
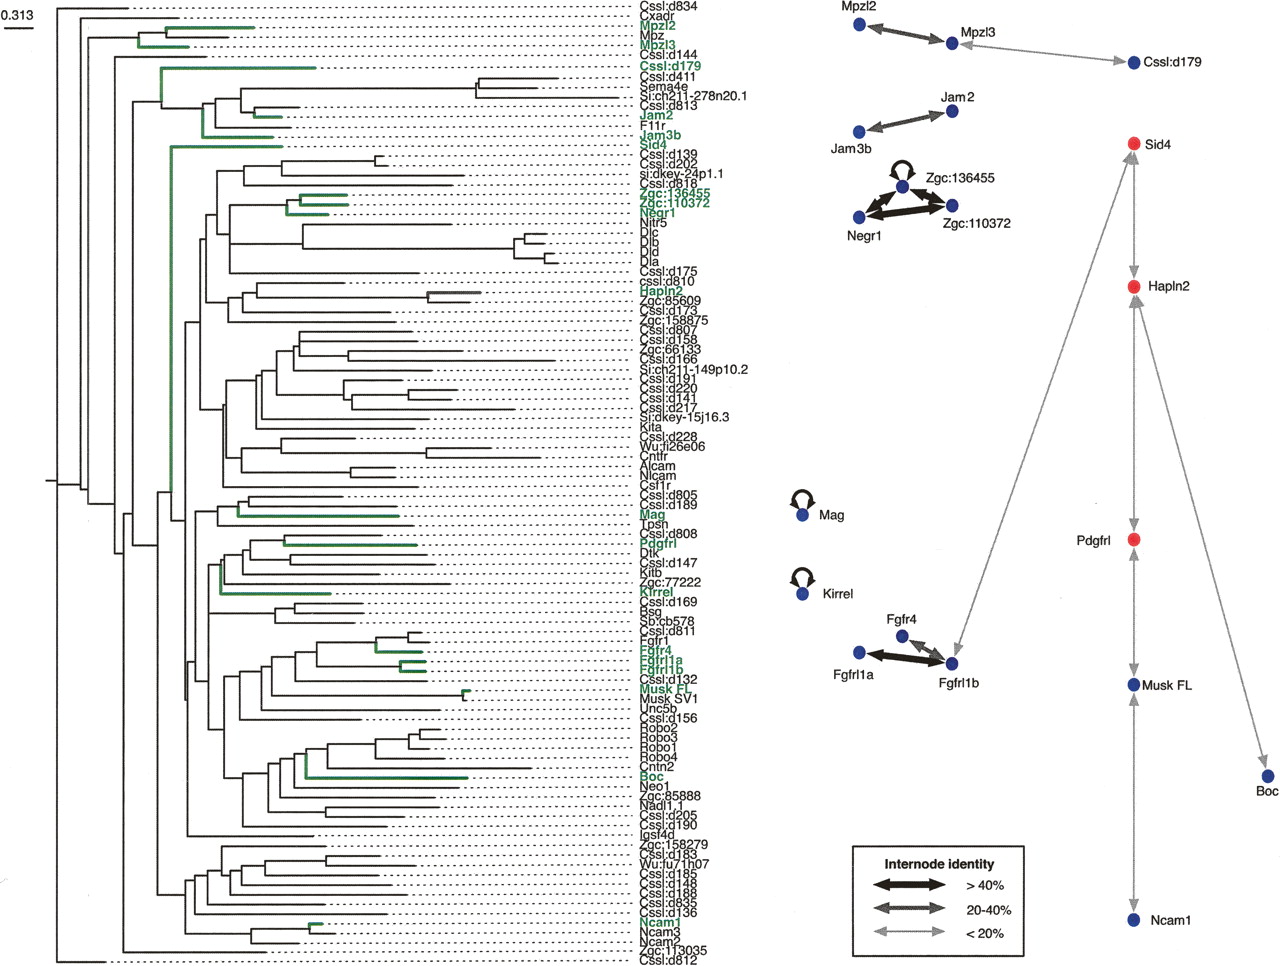
Figure 4.
Interactions between paralogous proteins are enriched within the extracellular interaction network. A phylogenetic tree showing the relationships of the non-redundant protein ectodomains used within the screen is shown. Names and branches representing the interacting proteins from the network are highlighted in green. The line widths in the interaction network reflect the sequence identities between interacting proteins as described in the key. Homophilic interactions are shown for completeness.


