
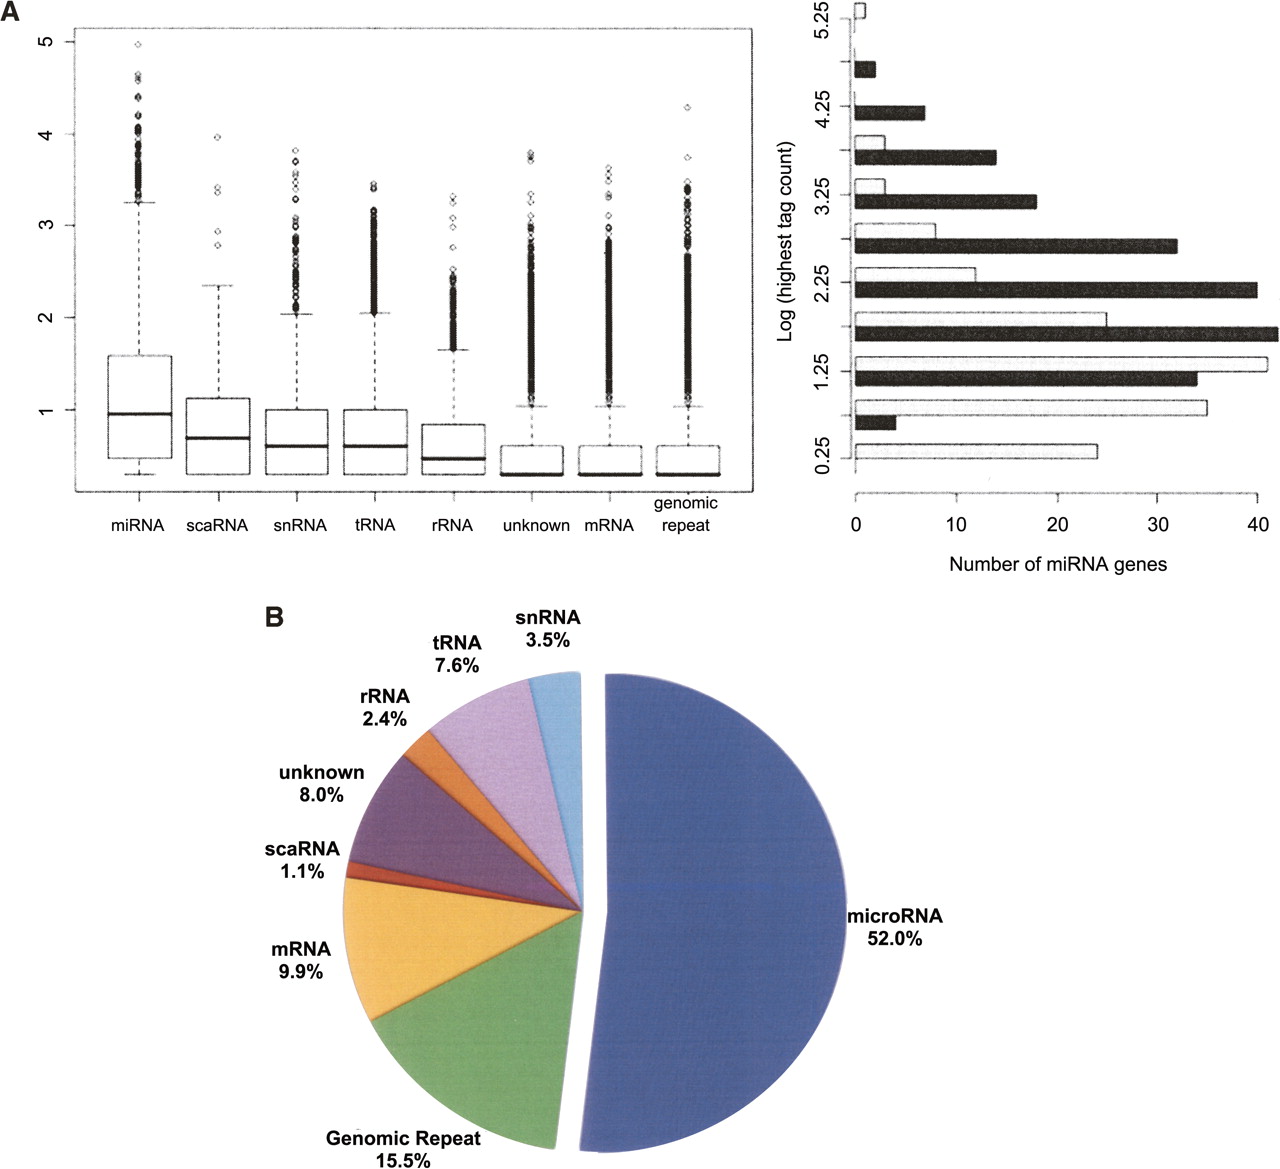
Distributions of sequence counts for the different classes of small RNAs. (A) The box plot (left) shows the relative expression levels of sequences in each of the eight major classes of small RNAs (log10 transformation) in the hESC small RNA library. miRNAs were the most highly expressed class (mean sequence count = 253, median sequence count = 9). The most abundant miRNA in this library was miR-103, which had 91,398 instances of the most common isomiR in this library and nearly 120,000 in the matched library (EB). The highest log-transformed count between the two libraries (right) for all miRNAs identified as differentially expressed (black) is roughly normal (mean = 2.32, median = 2.17), representing a tag count of 1743 and 151, respectively. The miRNAs detected in at least one of the libraries but not significantly differentially expressed are shown in light gray for comparison. There is a slight enrichment of miRNAs with lower absolute expression in this group (mean = 1.35, median = 1.24), suggesting miRNAs with higher absolute expression levels are more likely to be identified as differentially expressed. (B) Total counts for the eight classes in the box plot are summarized. They are represented as a fraction of the total sequences that had at least one perfect alignment to the human reference genome (1,631,559 total).


