
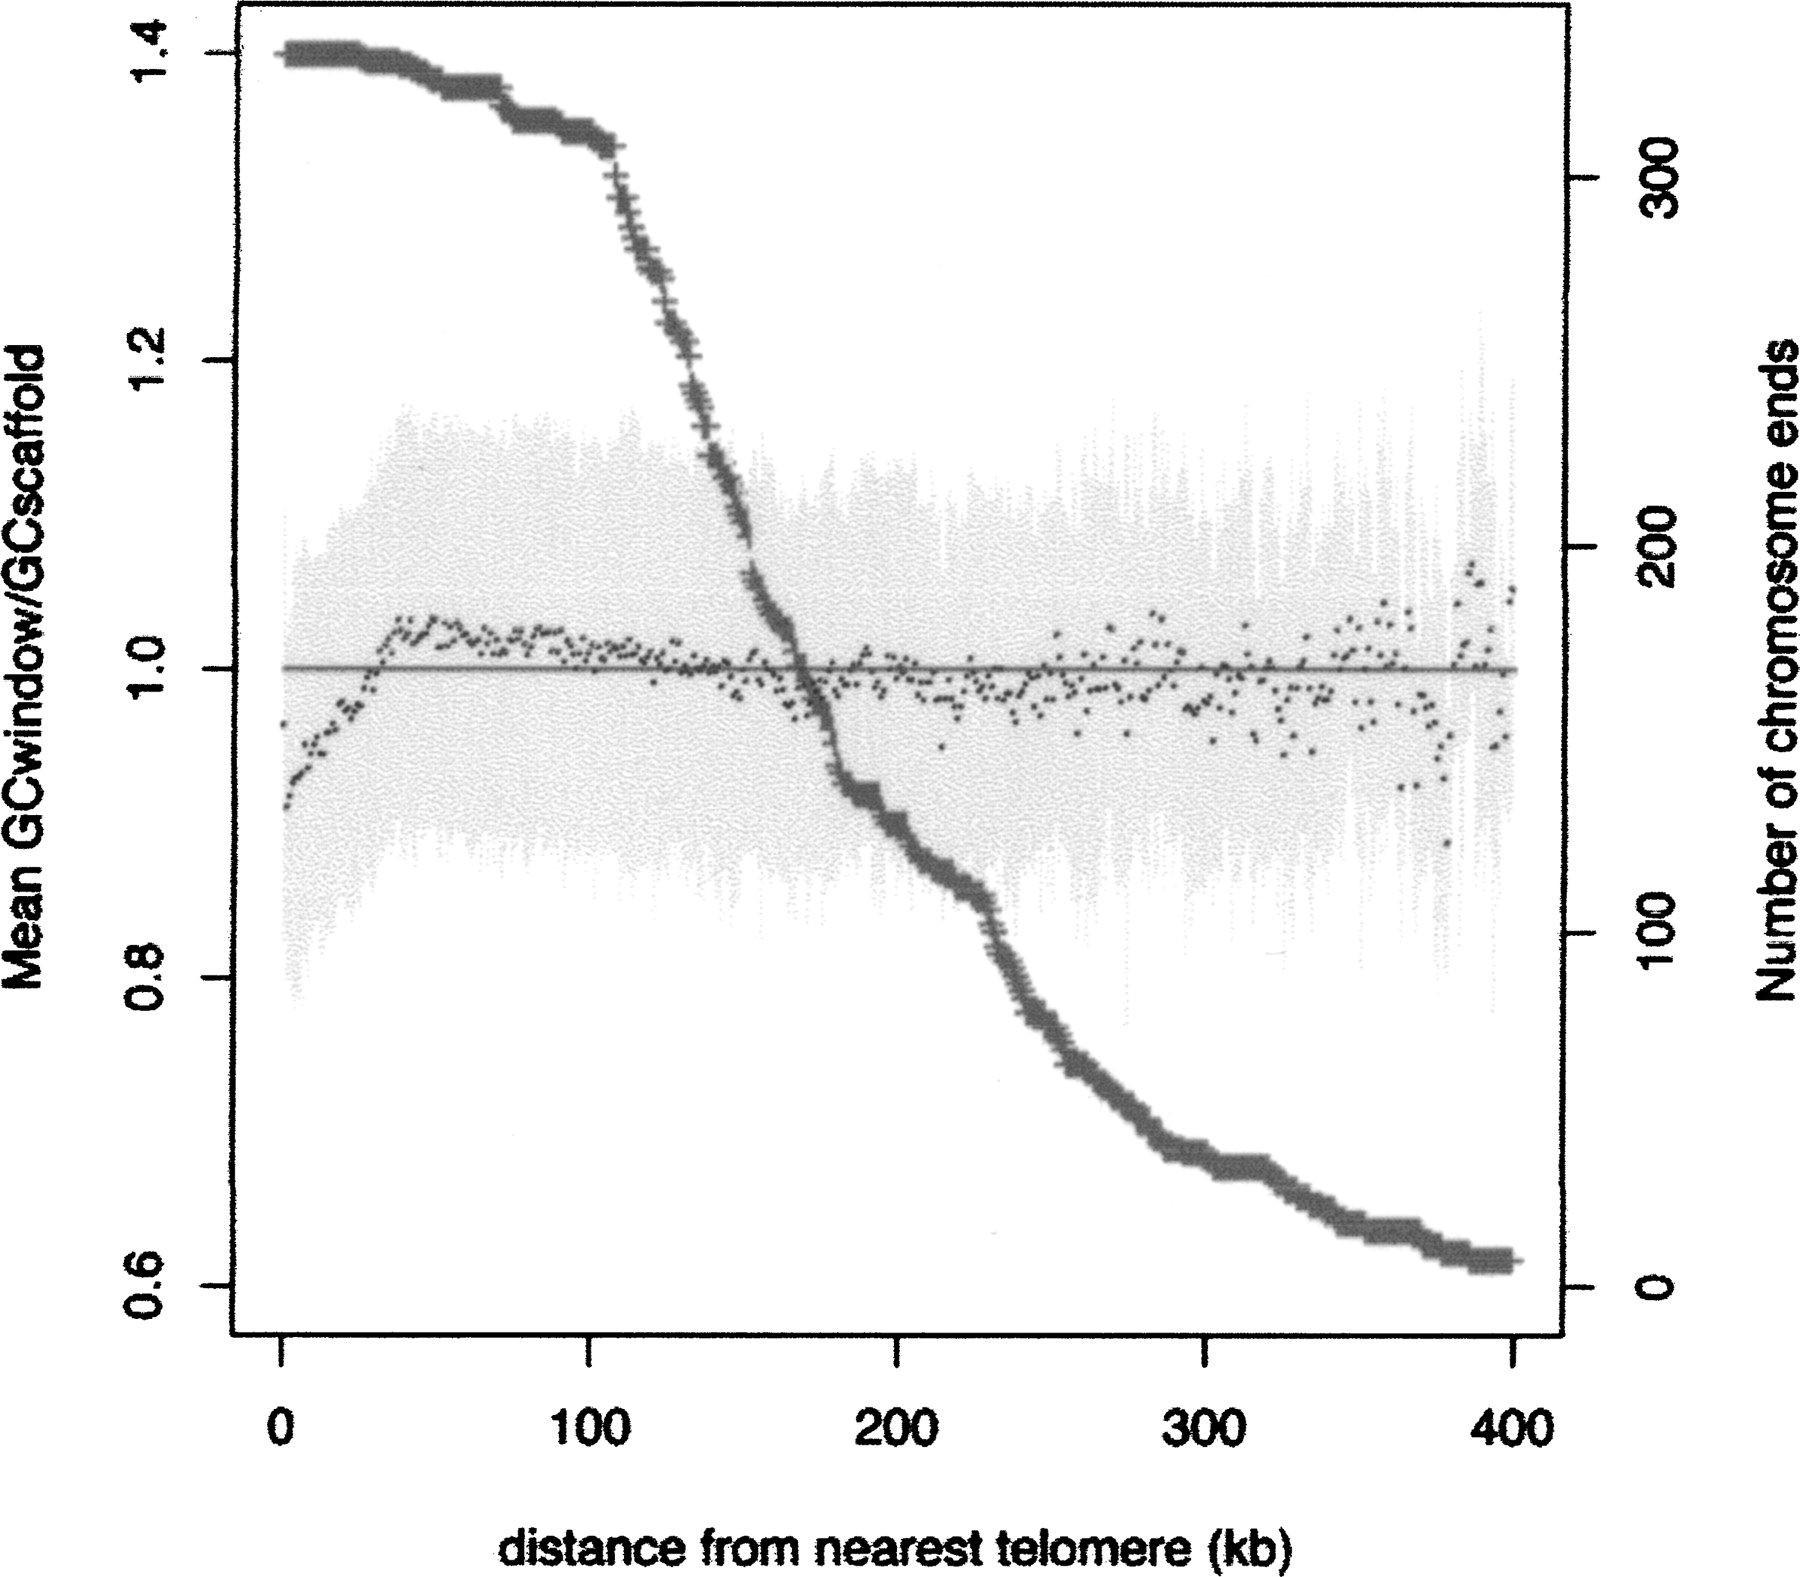
Figure 5.
G+C content variation along chromosomes. Mean G+C content (calculated in nonoverlapping 1-kb windows and normalized against the average G+C content of the scaffold) is plotted as a function of the distance from the nearest telomere (black points) ±SD (light-gray lines). Only chromosome ends with validated telomeres were used for the calculation. The number of chromosome ends decreases as the distance from the telomere increases (dark-gray curve and second Y-axis), because fewer and fewer scaffolds are of a size equal to or greater than twice the distance (X-axis).


