
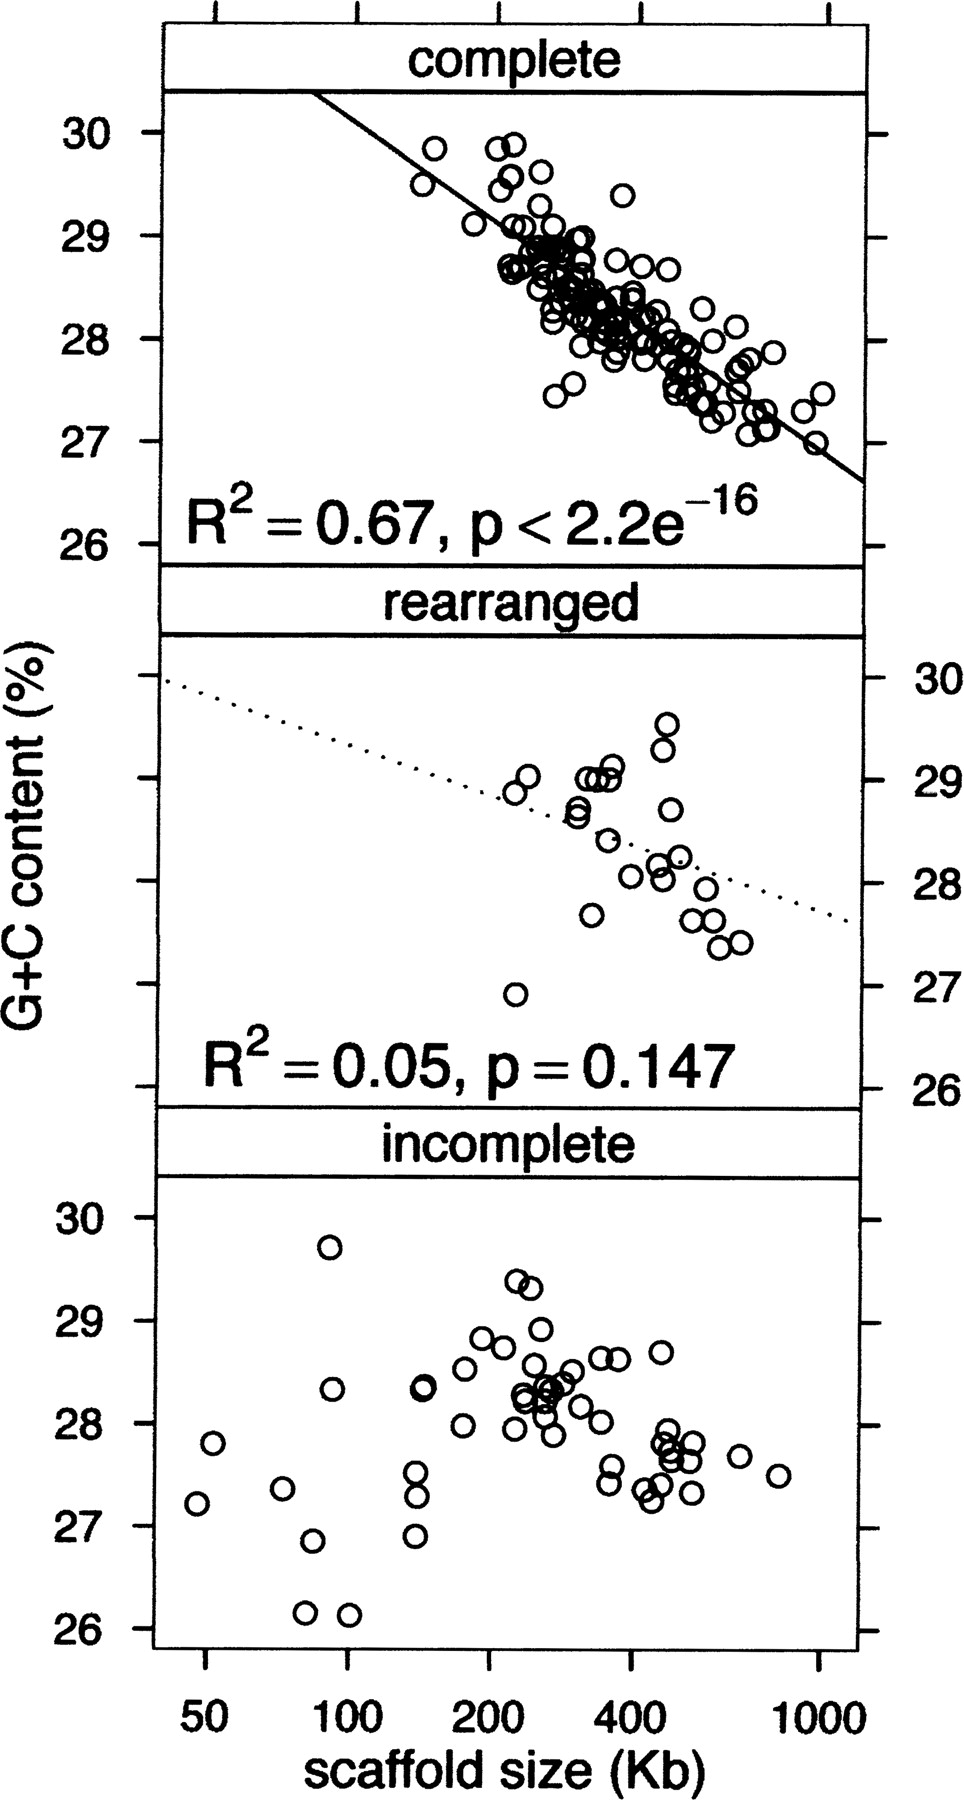
Figure 4.
G+C content is inversely proportional to chromosome size. Scatter plots of G+C content of scaffolds as a function of scaffold size. The data for complete MAC chromosomes can be fit by a linear regression model. The “rearranged” scaffolds are complete chromosomes from clusters with translocations since the recent WGD as shown in Figure 3E; not all of the scaffolds in this group have changed size since the WGD; however, inclusion of this group with the other complete chromosomes adds several significant outliers to the data and reduces the value of the correlation coefficient R2.


