
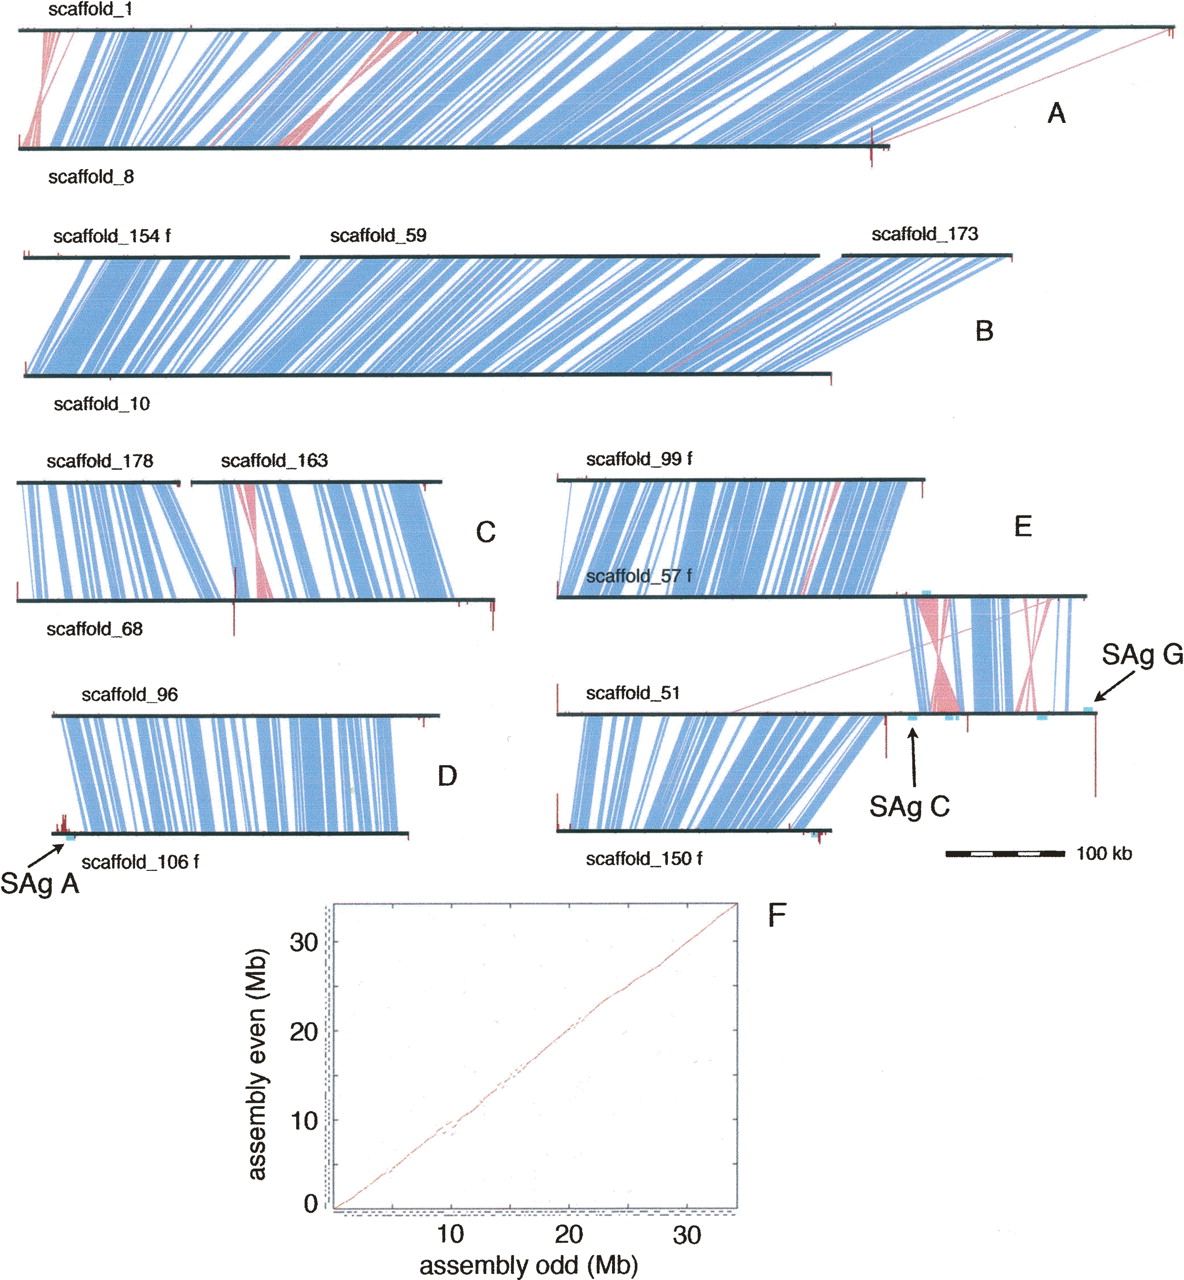
Pairs of chromosomes revealed by internal nucleotide comparison of the MAC genome assembly. Examples of the clusters obtained from the internal nucleotide comparison (see Methods). The majority of clusters show pairs of complete MAC chromosomes as in A and D. The cluster in B corresponds to two complete MAC chromosomes, but one of them consists of three scaffolds separated by two sequencing gaps. The cluster in C illustrates possible assemblies of three polymorphic chromosomes that cover a single region; scaffold 68 is a consensus of two shorter chromosomes and one long one, resulting from fragmentation or internal deletion upon DNA elimination, while scaffolds 178 and 163 represent chromosomes created by fragmentation. The cluster in E shows a translocation that has occurred since the recent WGD. Note that scaffold 51 contains two internal sites with remapped telomeric repeats. The leftmost site corresponds to the MIC elimination region that was sequenced in P. primaurelia (Le Mouël et al. 2003). Horizontal black lines, scaffolds; blue polygons, segments of >82% nucleotide identity; pink polygons, inverted segments of >82% nucleotide identity; vertical maroon lines are proportional in height to the number of remapped reads that contain telomere repeats (i.e., at least three repeats of CCC[CA]AA with no more than one mismatch), the repeats were masked for the alignment of the reads against the assembly; turquoise boxes, remapped surface antigen genes. (F) Dot plot internal comparison of the MAC genome assembly. The genome was divided into two arbitrary half genomes for the dot plot, using the drawings of chromosome clusters related by the recent WGD. The small staggered lines along the outside of each axis represent the individual scaffolds.


