
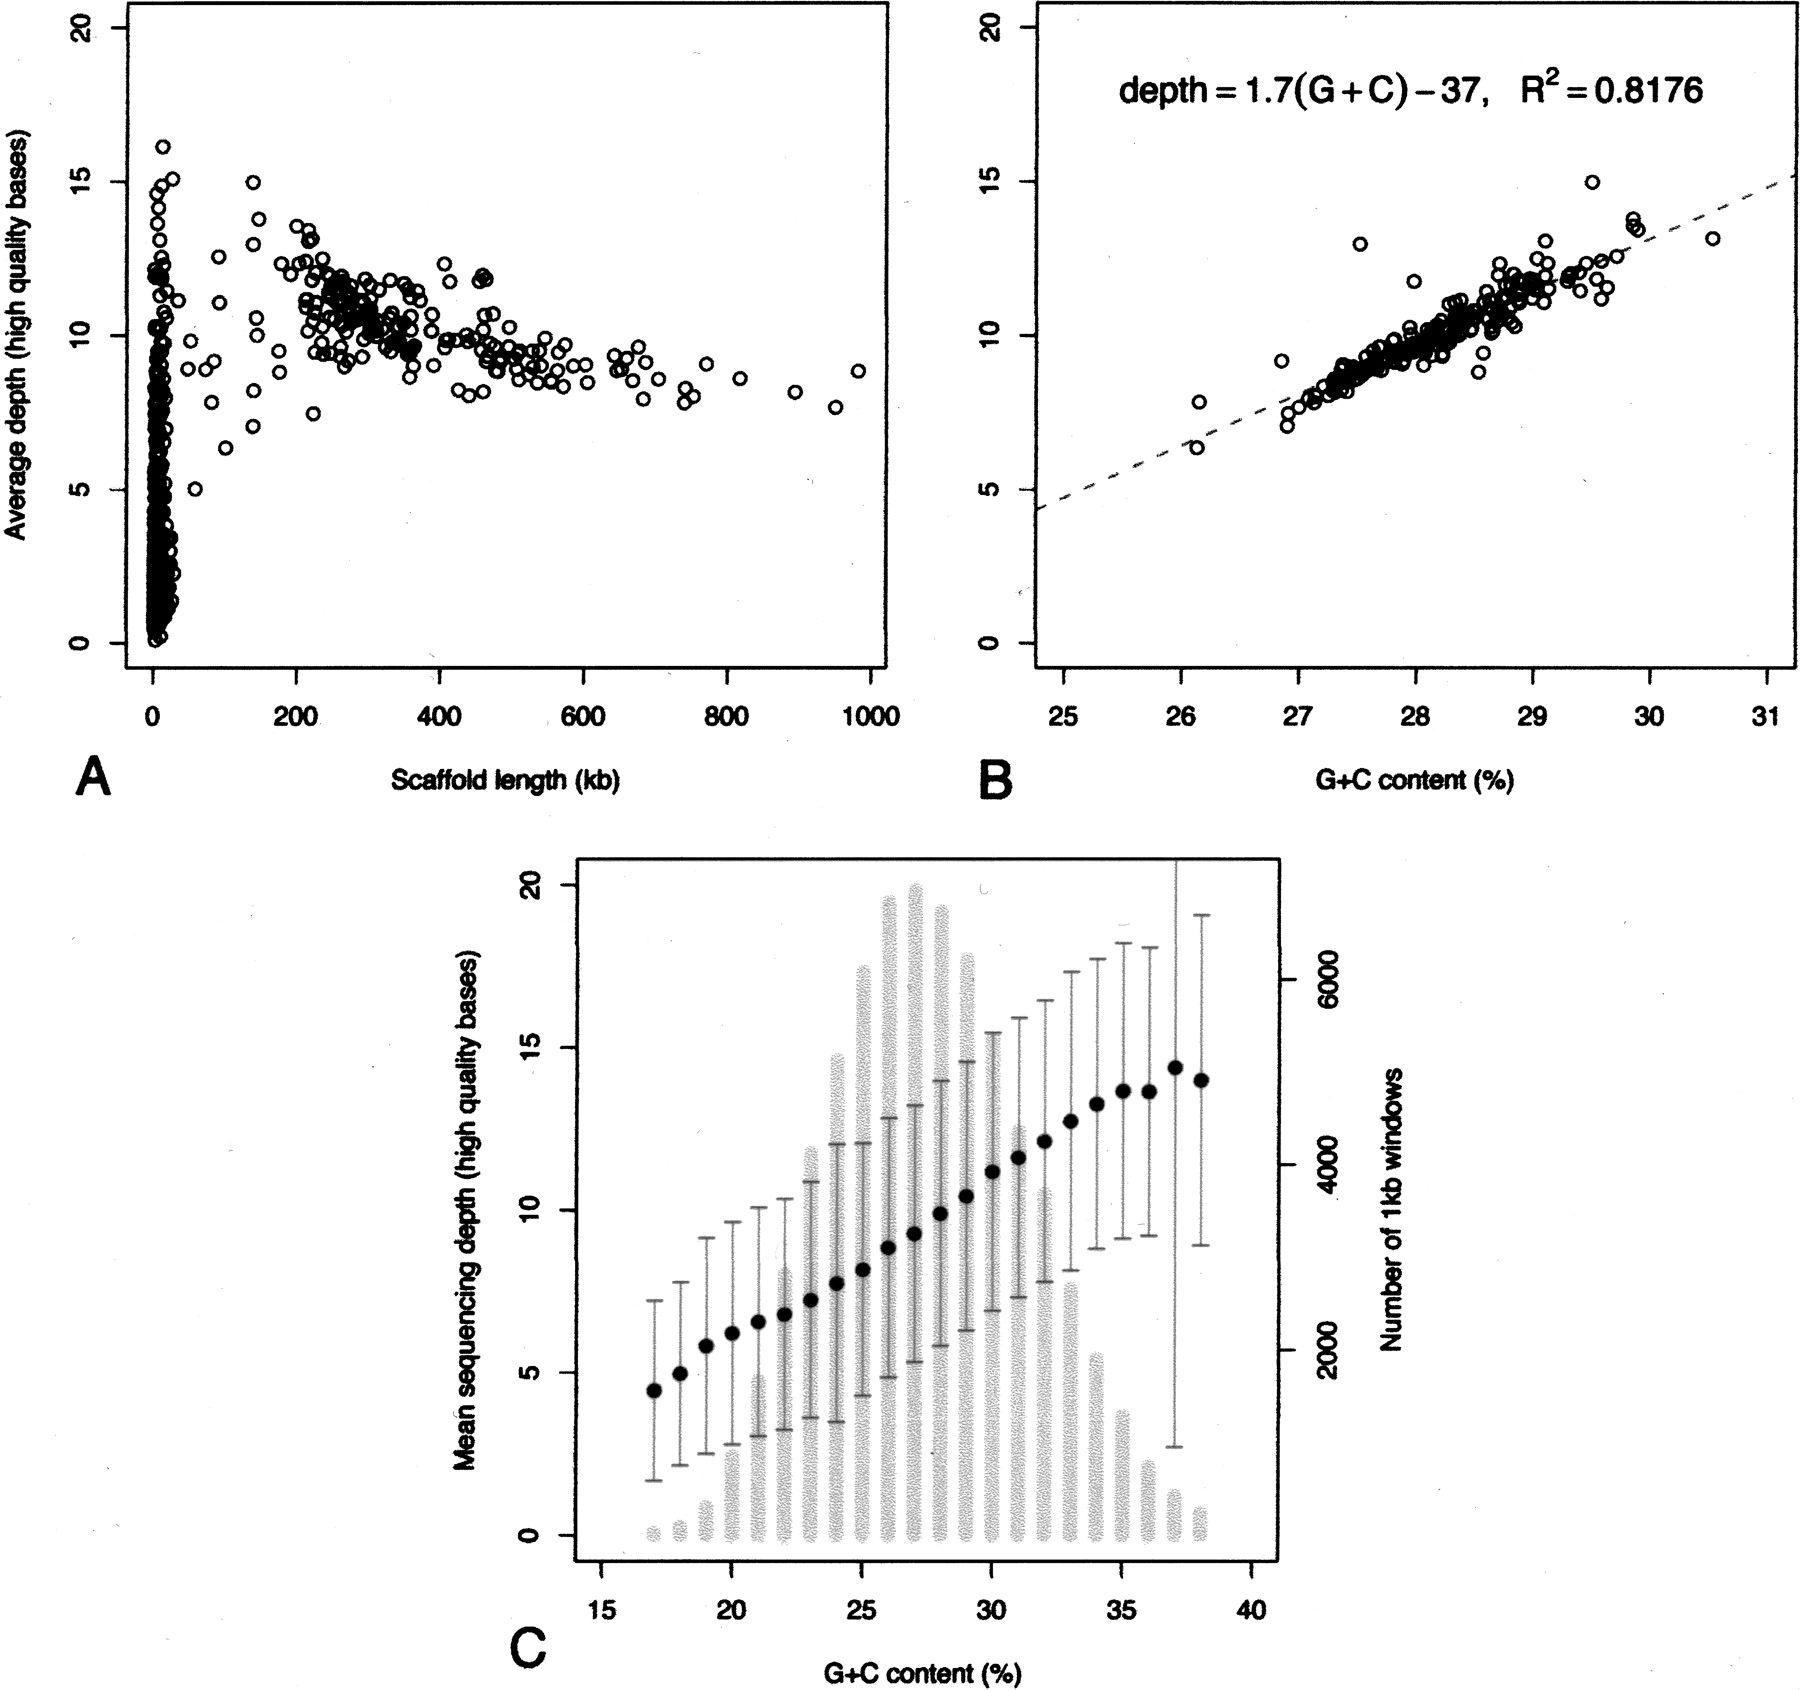
Depth of sequencing coverage and G+C content of the MAC genome assembly. (A) Scatter plot of average sequence depth in each of the 697 scaffolds of the assembly as a function of the size in nucleotides of the scaffold. The average sequencing depth is defined as the average number of reads that cover each nucleotide of the scaffold. (B) Scatter plot of the average sequencing depth of each of the 188 chromosome-sized scaffolds (>47 kb) as a function of the G+C content of the scaffold. The points were fit by linear regression, R2 = 0.82, P < 10−4. (C) Average sequencing depth and G+C content were calculated in 1-kb nonoverlapping windows for the 188 chromosome-sized scaffolds. Primary Y-axis: average of the sequencing depths for all of the 1-kb windows with the same G+C content (bins of 1%), plus or minus the SD, represented by black dots and dark-gray error bars, is plotted as a function of G+C content. Secondary Y-axis: histogram of G+C content, calculated using the 1-kb nonoverlapping windows (light-gray vertical bars).


