
Table 4.
Genes with significant SNP-specific AI
Click on table to view larger version.
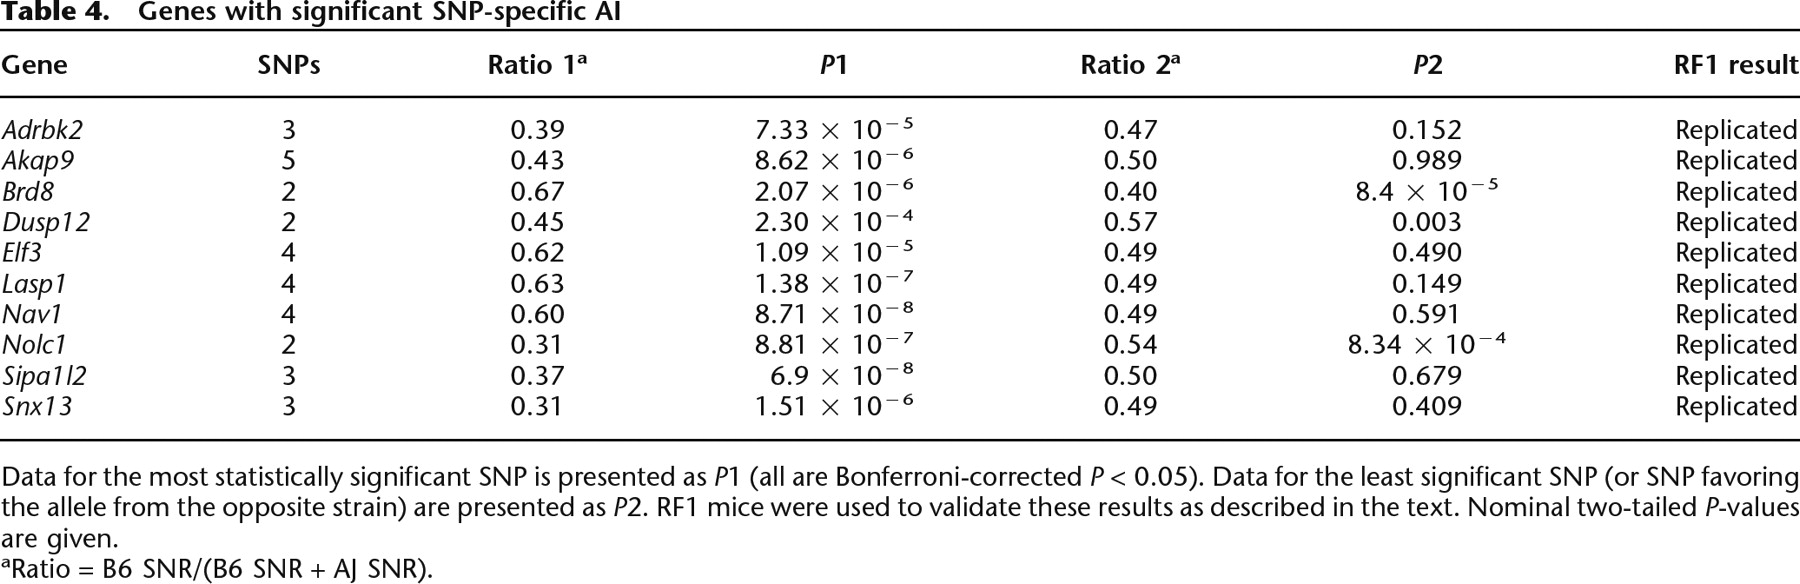
Data for the most statistically significant SNP is presented as P1 (all are Bonferroni-corrected P < 0.05). Data for the least significant SNP (or SNP favoring the allele from the opposite strain) are presented as P2. RF1 mice were used to validate these results as described in the text. Nominal two-tailed P-values are given.
aRatio = B6 SNR/(B6 SNR + AJ SNR).


