
Table 1.
Results from pilot study
Click on table to view larger version.
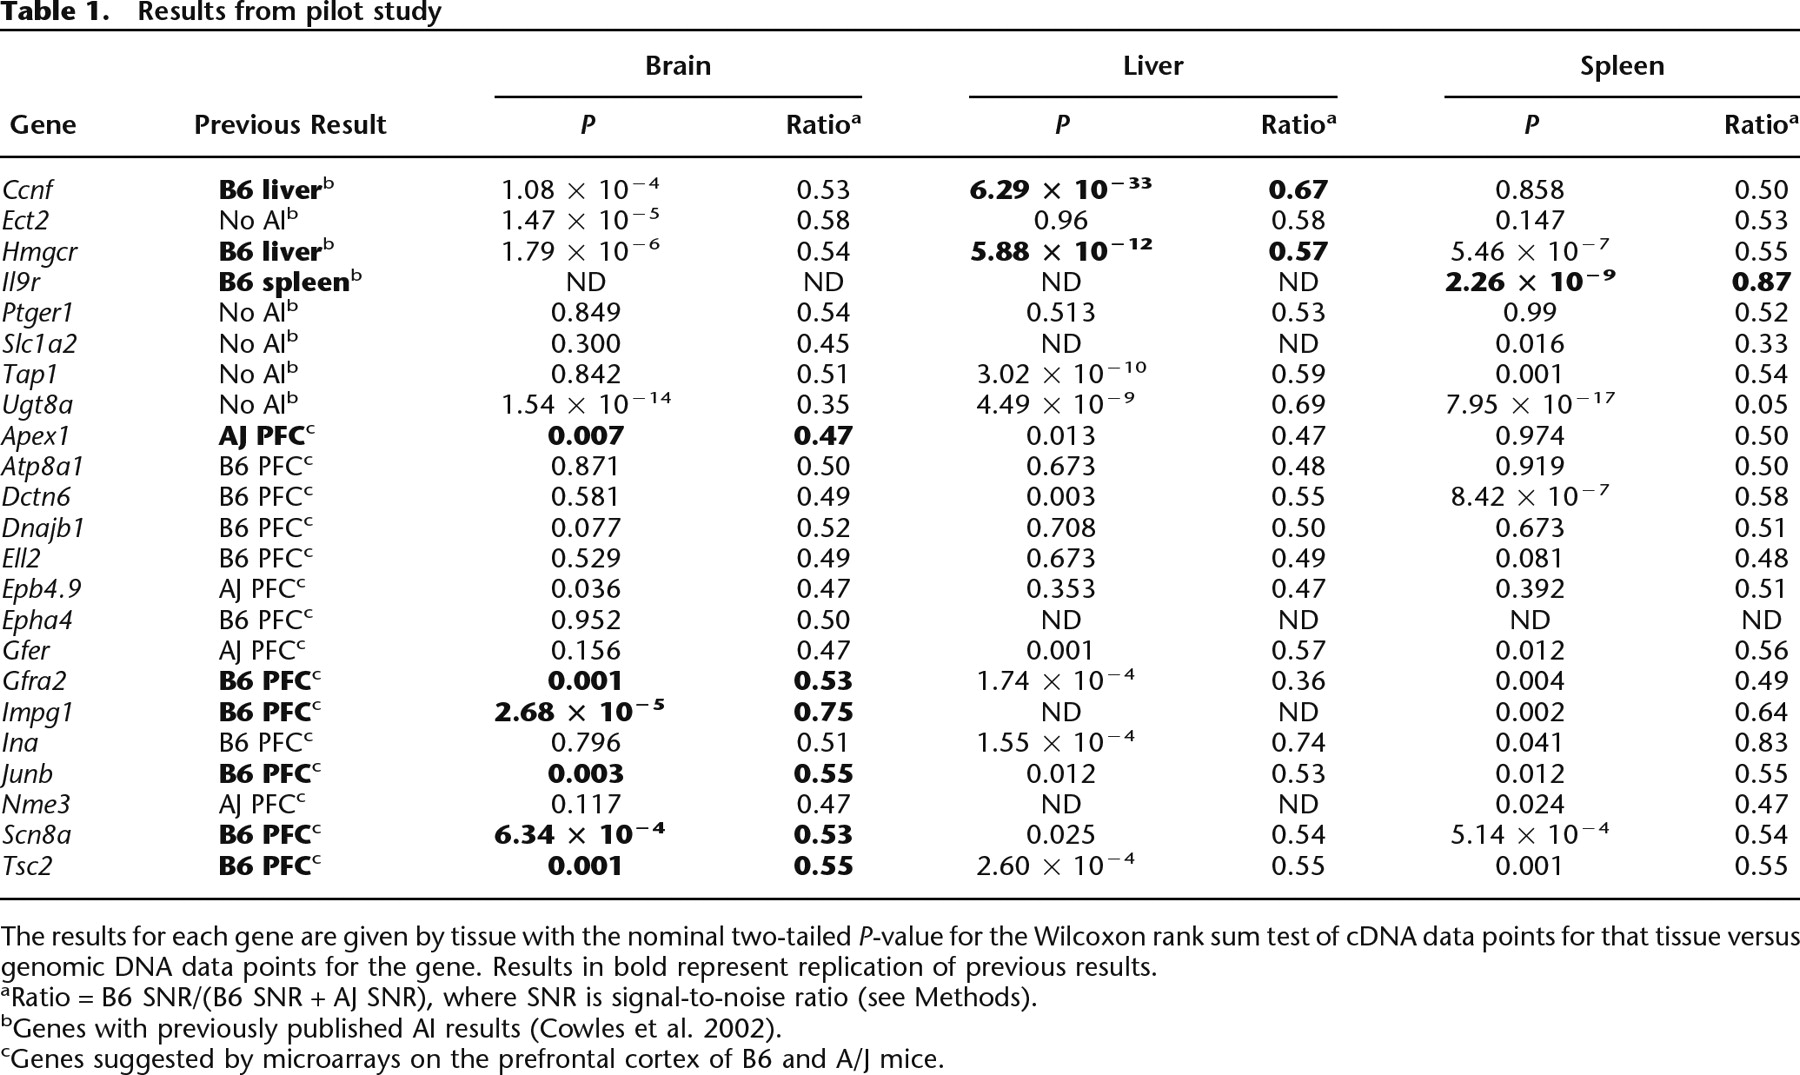
The results for each gene are given by tissue with the nominal two-tailed P-value for the Wilcoxon rank sum test of cDNA data points for that tissue versus genomic DNA data points for the gene. Results in bold represent replication of previous results.
aRatio = B6 SNR/(B6 SNR + AJ SNR), where SNR is signal-to-noise ratio (see Methods).
bGenes with previously published AI results (Cowles et al. 2002).
cGenes suggested by microarrays on the prefrontal cortex of B6 and A/J mice.


