
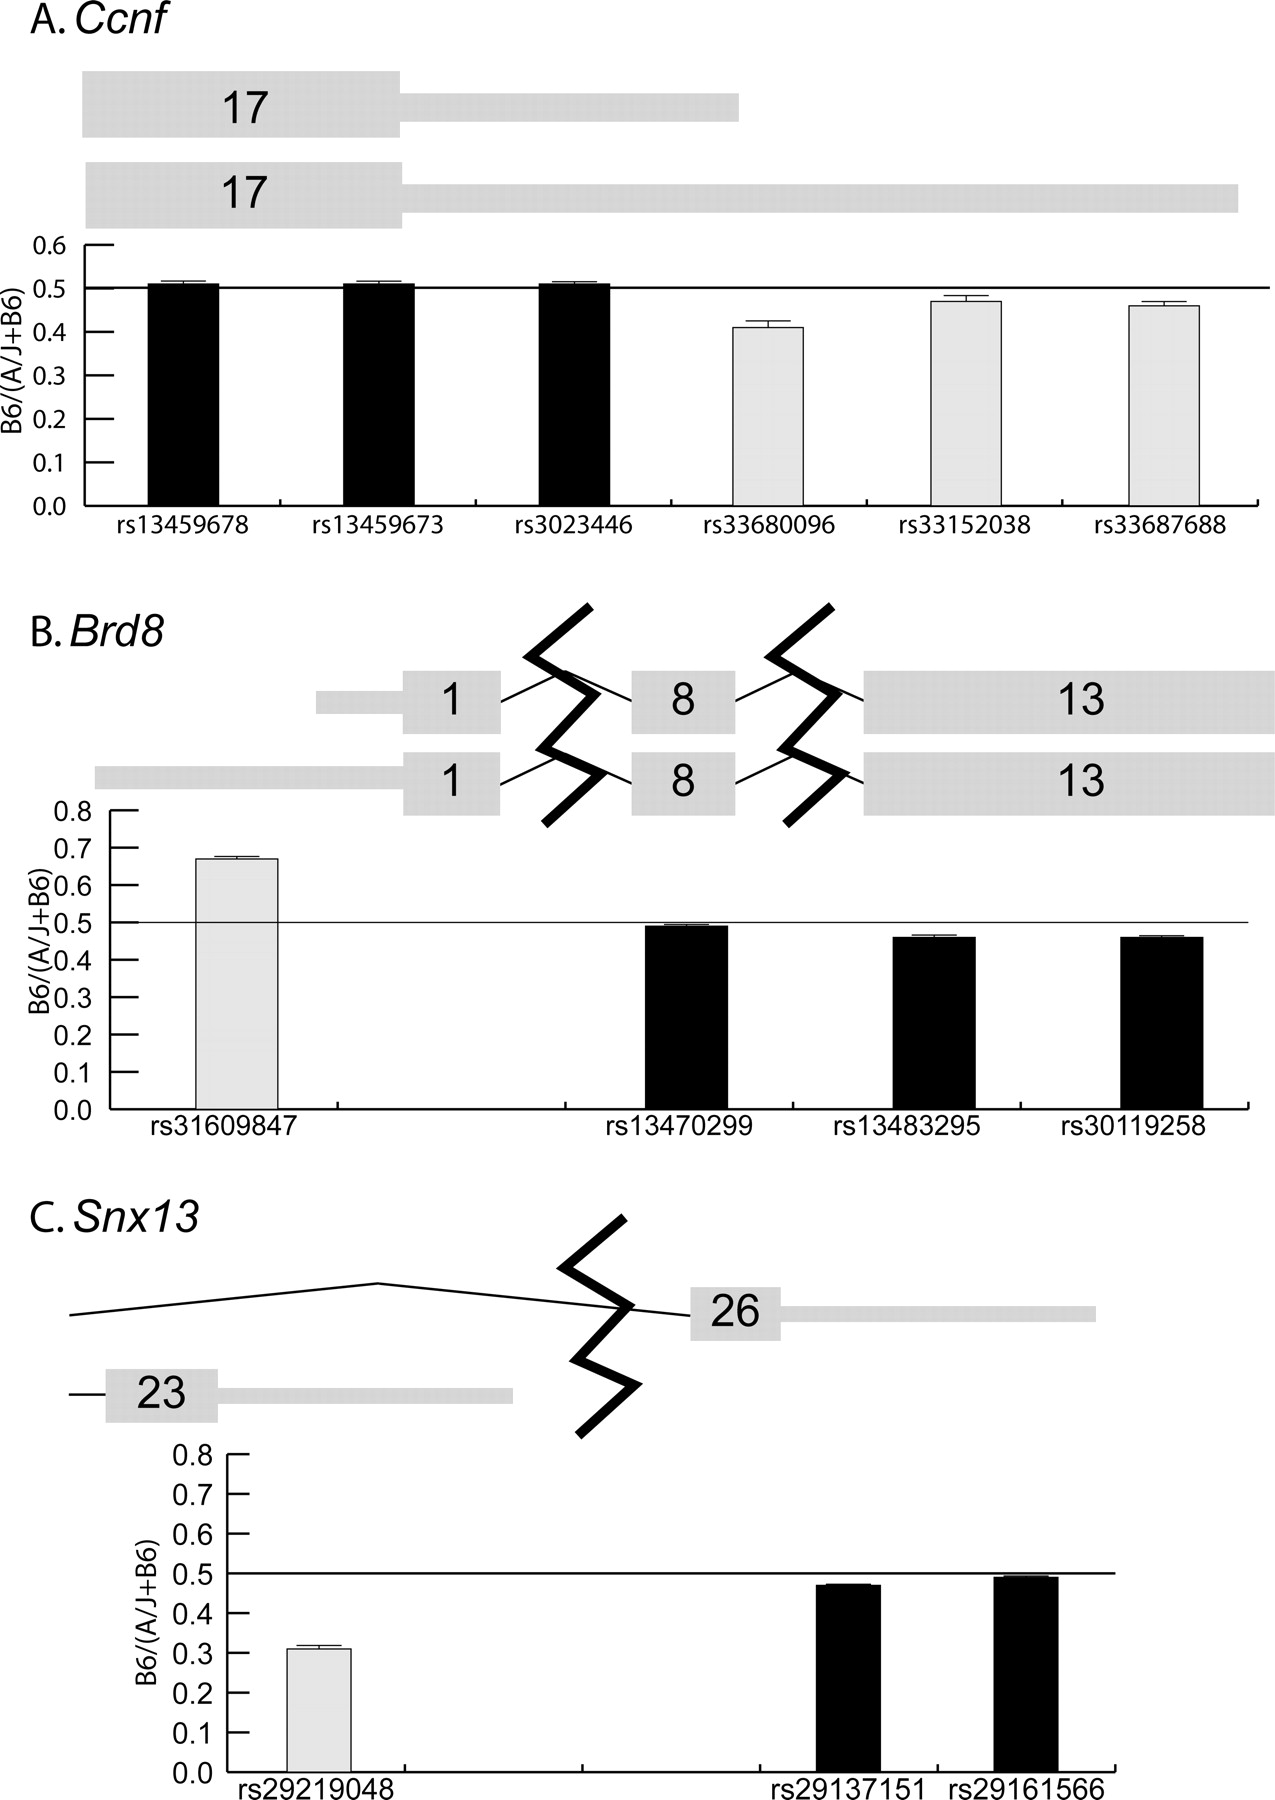
Examples of transcript-specific allelic imbalance. Representations of the exon and UTR structures are plotted with the thicker bars symbolizing coding sequence and the thinner bars symbolizing UTR sequence. Exon numbers are given in the bars for each exon. These diagrams are based on information from the UCSC Genome Browser (genome.ucsc.edu). Below the representation of each gene, a graph of B6/(A/J + B6) is plotted for SNPs that fall within the exons shown. The horizontal line across each graph marks a 50:50 ratio of B6 to A/J alleles. (A) Ccnf has two transcripts that differ in 3′ UTR length; data shown are from spleen. (B) Brd8 has two transcripts that differ in 5′ UTR length; data shown are the average of all tissues. (C) Snx13 has two transcripts with different last exons and 3′ UTRs; data shown are the average of all tissues.


