
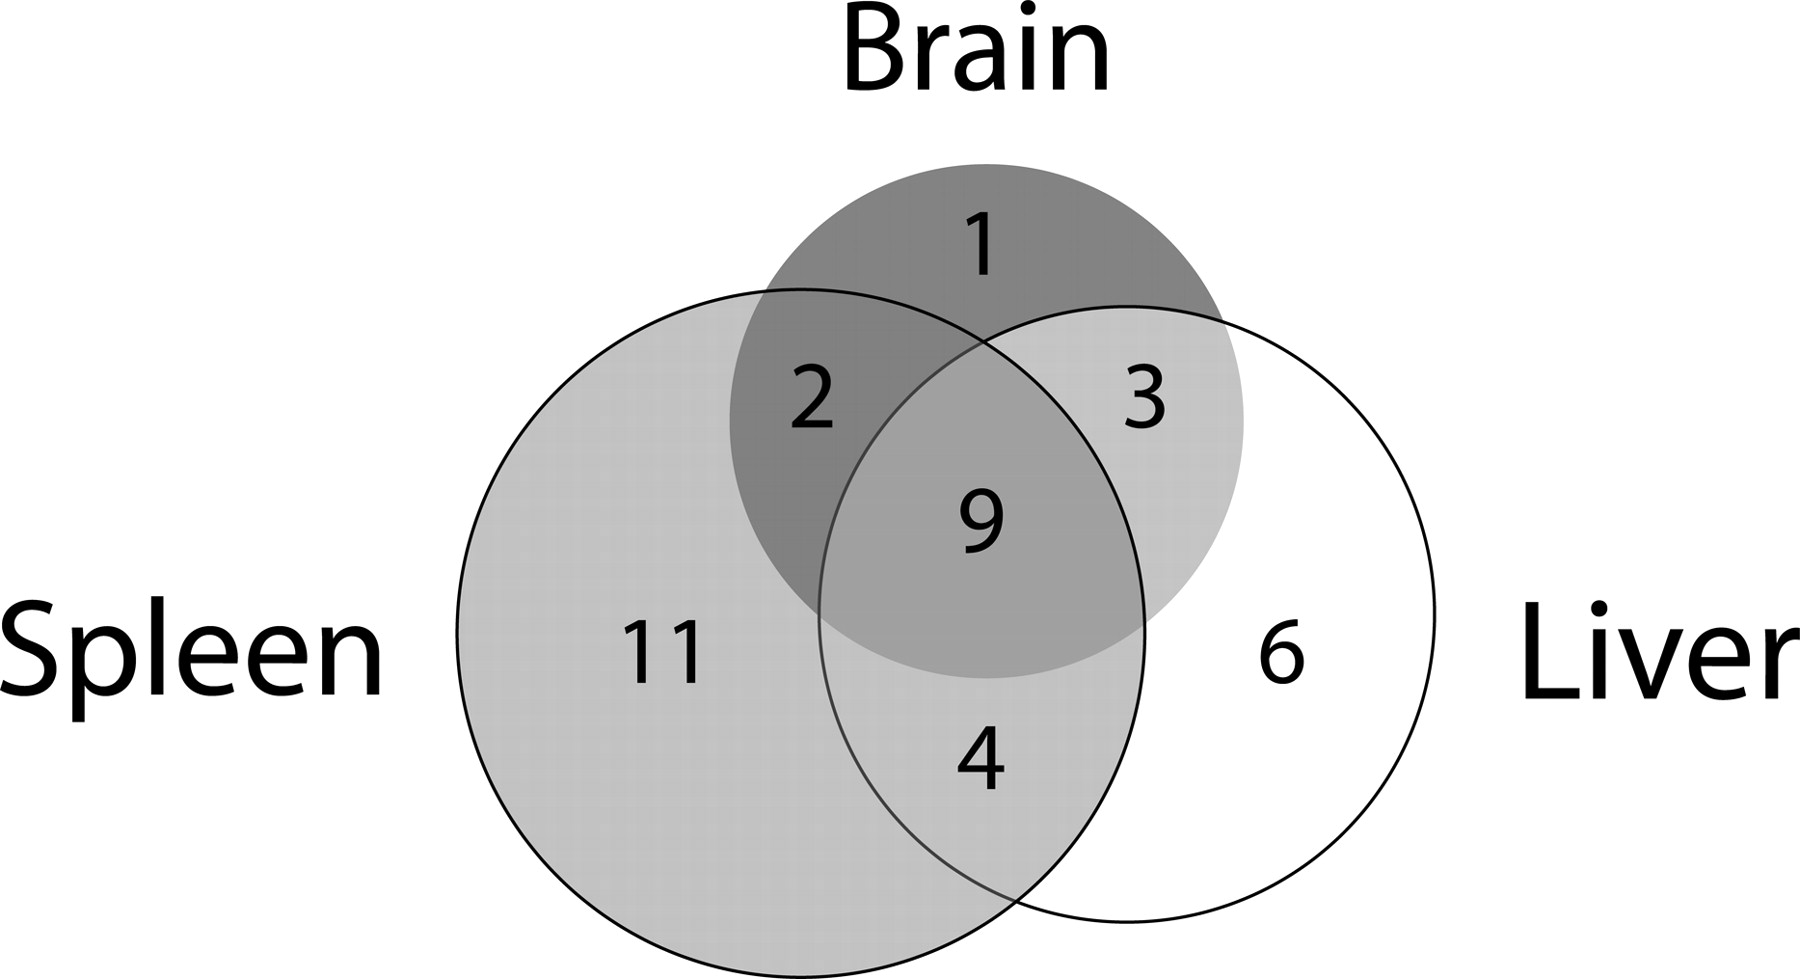
Figure 4.
Overlap of genes with allelic imbalance between tissues. For this analysis, only the 33 genes with any evidence of AI were considered. Three genes are represented twice in the diagram because two of the tissues had evidence for allelic imbalance favoring alleles from opposite strains.


