
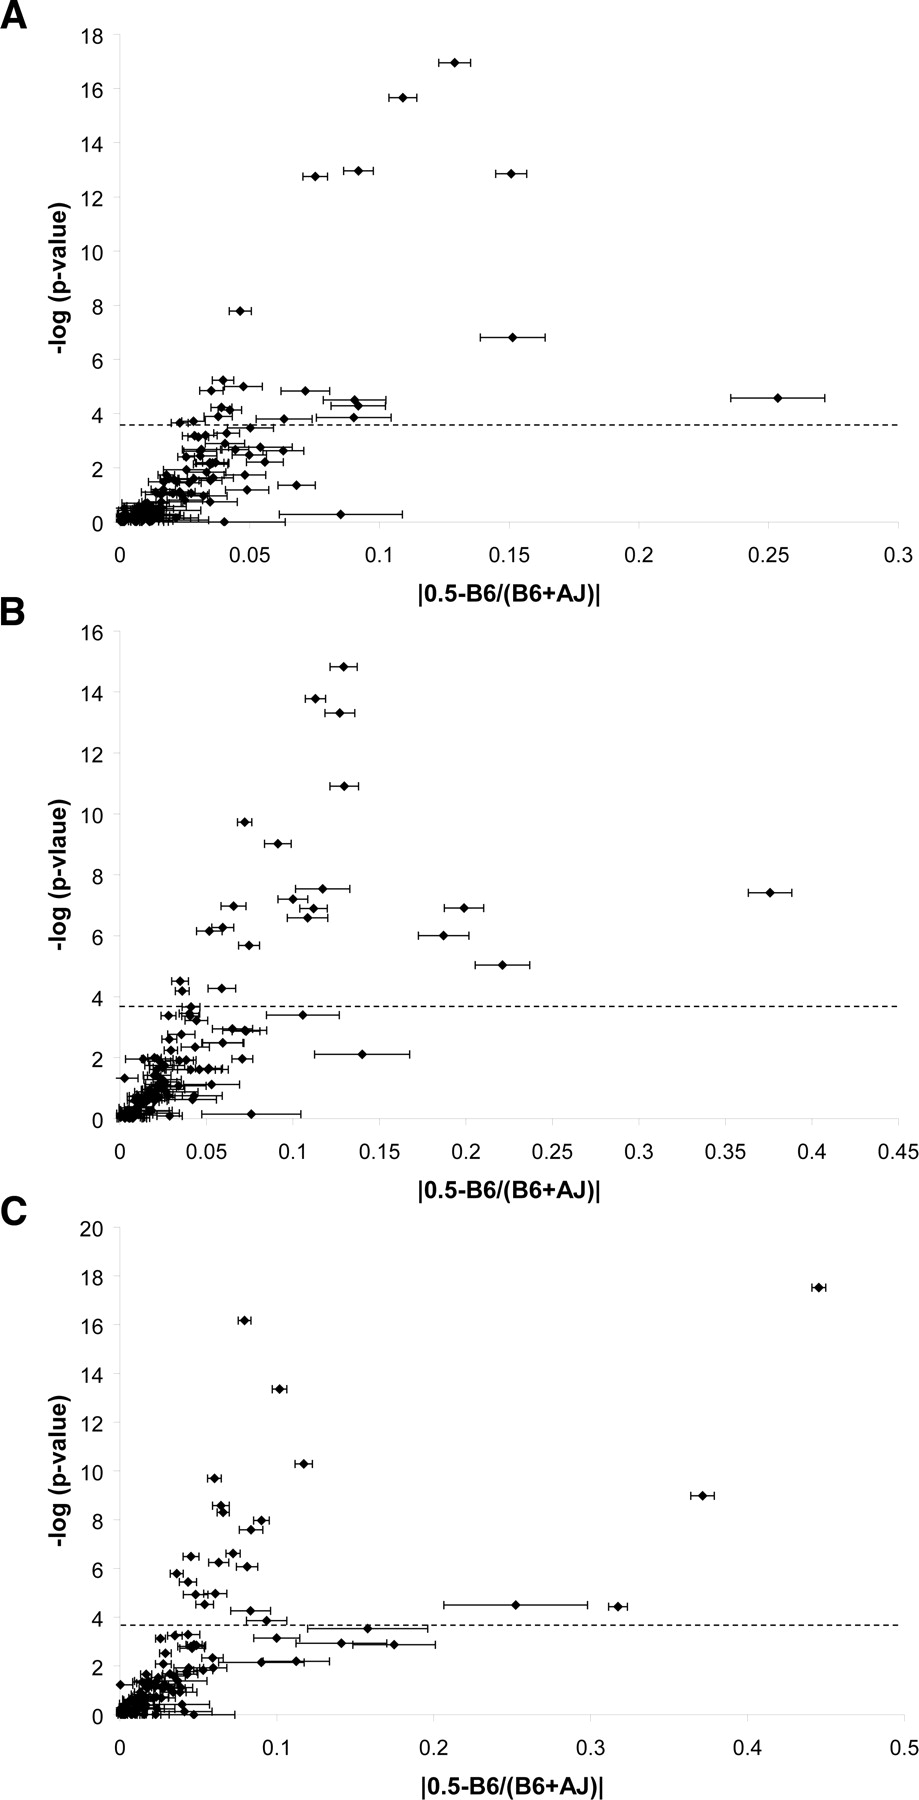
Figure 2.
Magnitude of allelic imbalance. The statistical significance from Wilcoxon rank sum tests (-log of the P-value) is plotted against the magnitude of AI (absolute value of the difference between 0.5 [no AI] and the average ratio B6/[AJ + B6]) for each of the 115 genes in each tissue. The dotted line indicates an empirical P = 0.05. Error bars are the standard error of the mean; genes with large standard errors have SNP differences in AI. (A) brain; (B) liver; (C) spleen.


