
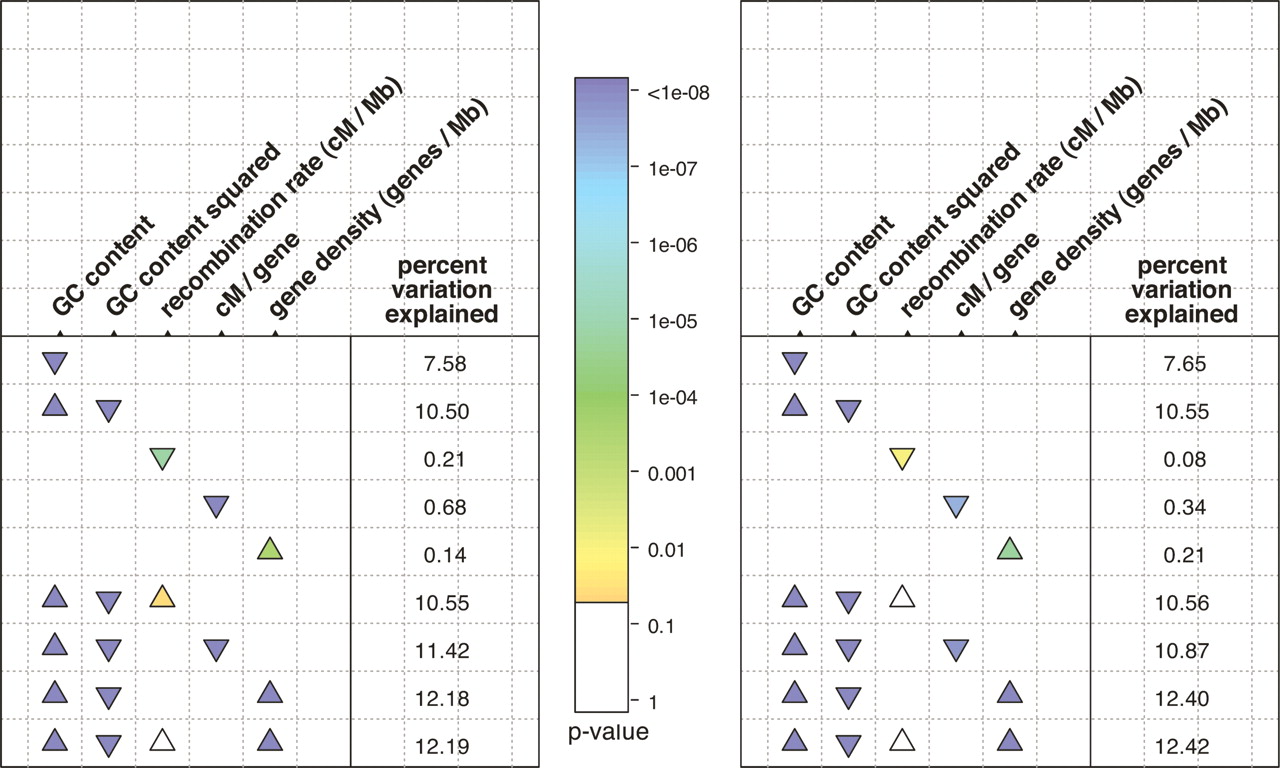
Summary of linear models, with normalized dN/dS as a response variable. The left and right panels show broad- and fine-scale recombination rates, respectively. Each row describes a linear model used to explain variation in quantile-normalized dN/dS. The columns list the predictor variables, and the presence of absence of a triangle indicates if a particular variable was used in the model. For example, the last model includes four terms: GC content, GC content squared, recombination rate, and gene density. The color of the triangles displays the P-value, coded by the colored bar in the center; it is based on a Student’s t-test, which tests whether the coefficient for that term differs significantly from zero. White triangles represent nonsignificant coefficients at the 0.05 level. The orientation of the triangles indicates the sign of the coefficient, with upward- and downward-pointing triangles indicating positive and negative coefficients, respectively. The column of numbers on the right of each panel is the percentage of the variation in quantile-normalized dN/dS that is explained by the model i.e., 100r2. GC content refers to GC4 content (see Methods). A more extensive summary of the linear models that we investigated is provided in Supplemental Figure 6.


