
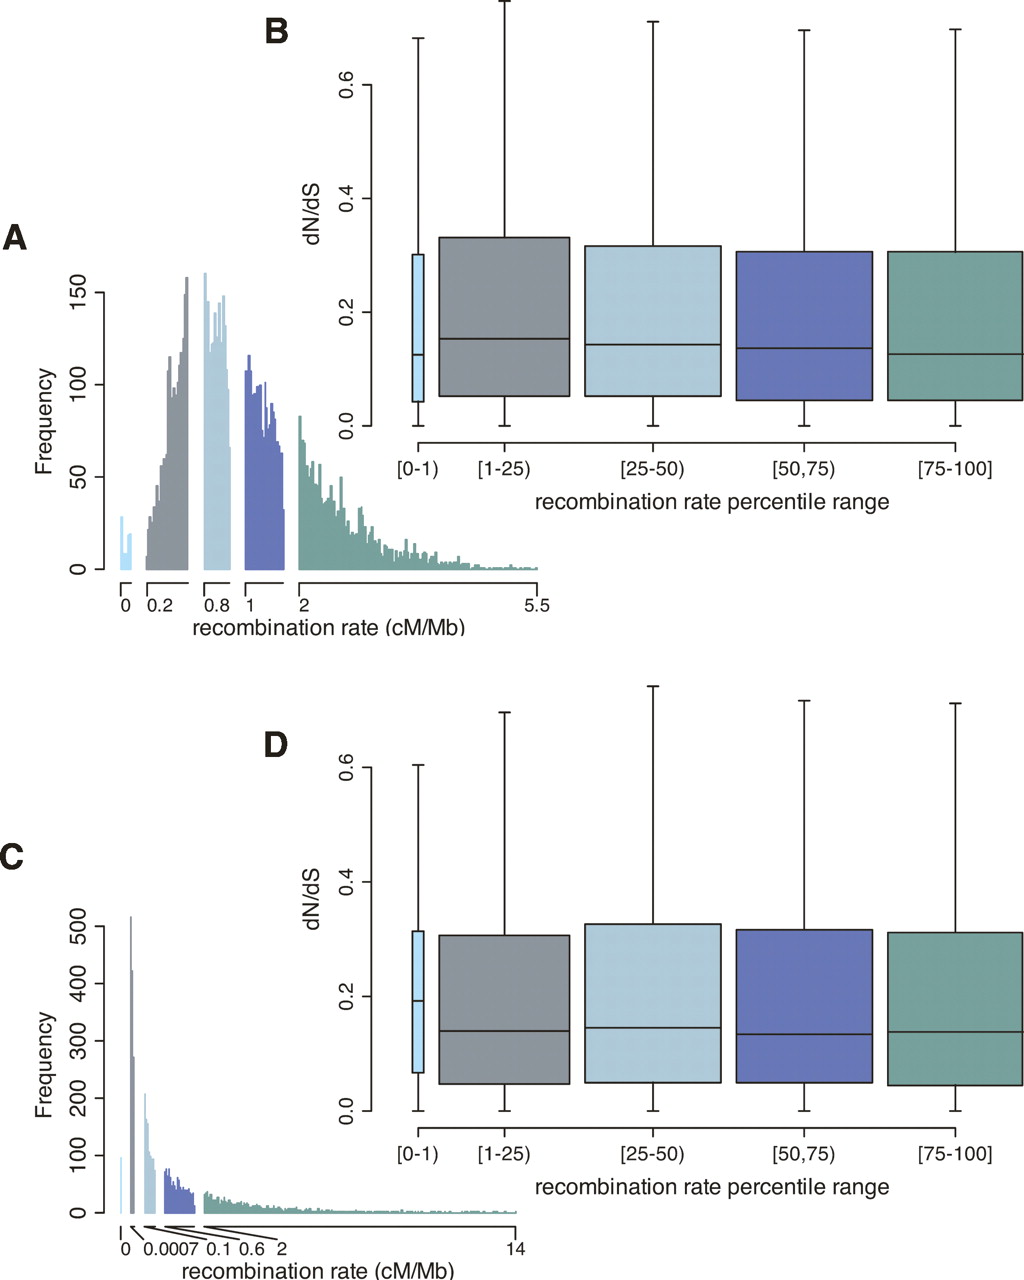
Summary of the relationship between dN/dS and the recombination rate. Colors correspond to recombination rate bins, which consist of the first percentile of the distribution and then four bins comprising the remaining 99% of the recombination rate distribution. Broad-scale rates are depicted in panels A and B and fine-scale rates in panels C and D. (A,C) The distribution of recombination rates for the ∼10,000 genes; (B,D) box plots of dN/dS by recombination rate bin. The boxes span the 25%–75% dN/dS quantiles with the internal horizontal line indicating the median rate; whiskers extend to the most extreme data point that is less than 1.5 times the length of the box. Outliers beyond the whiskers are not shown.


