
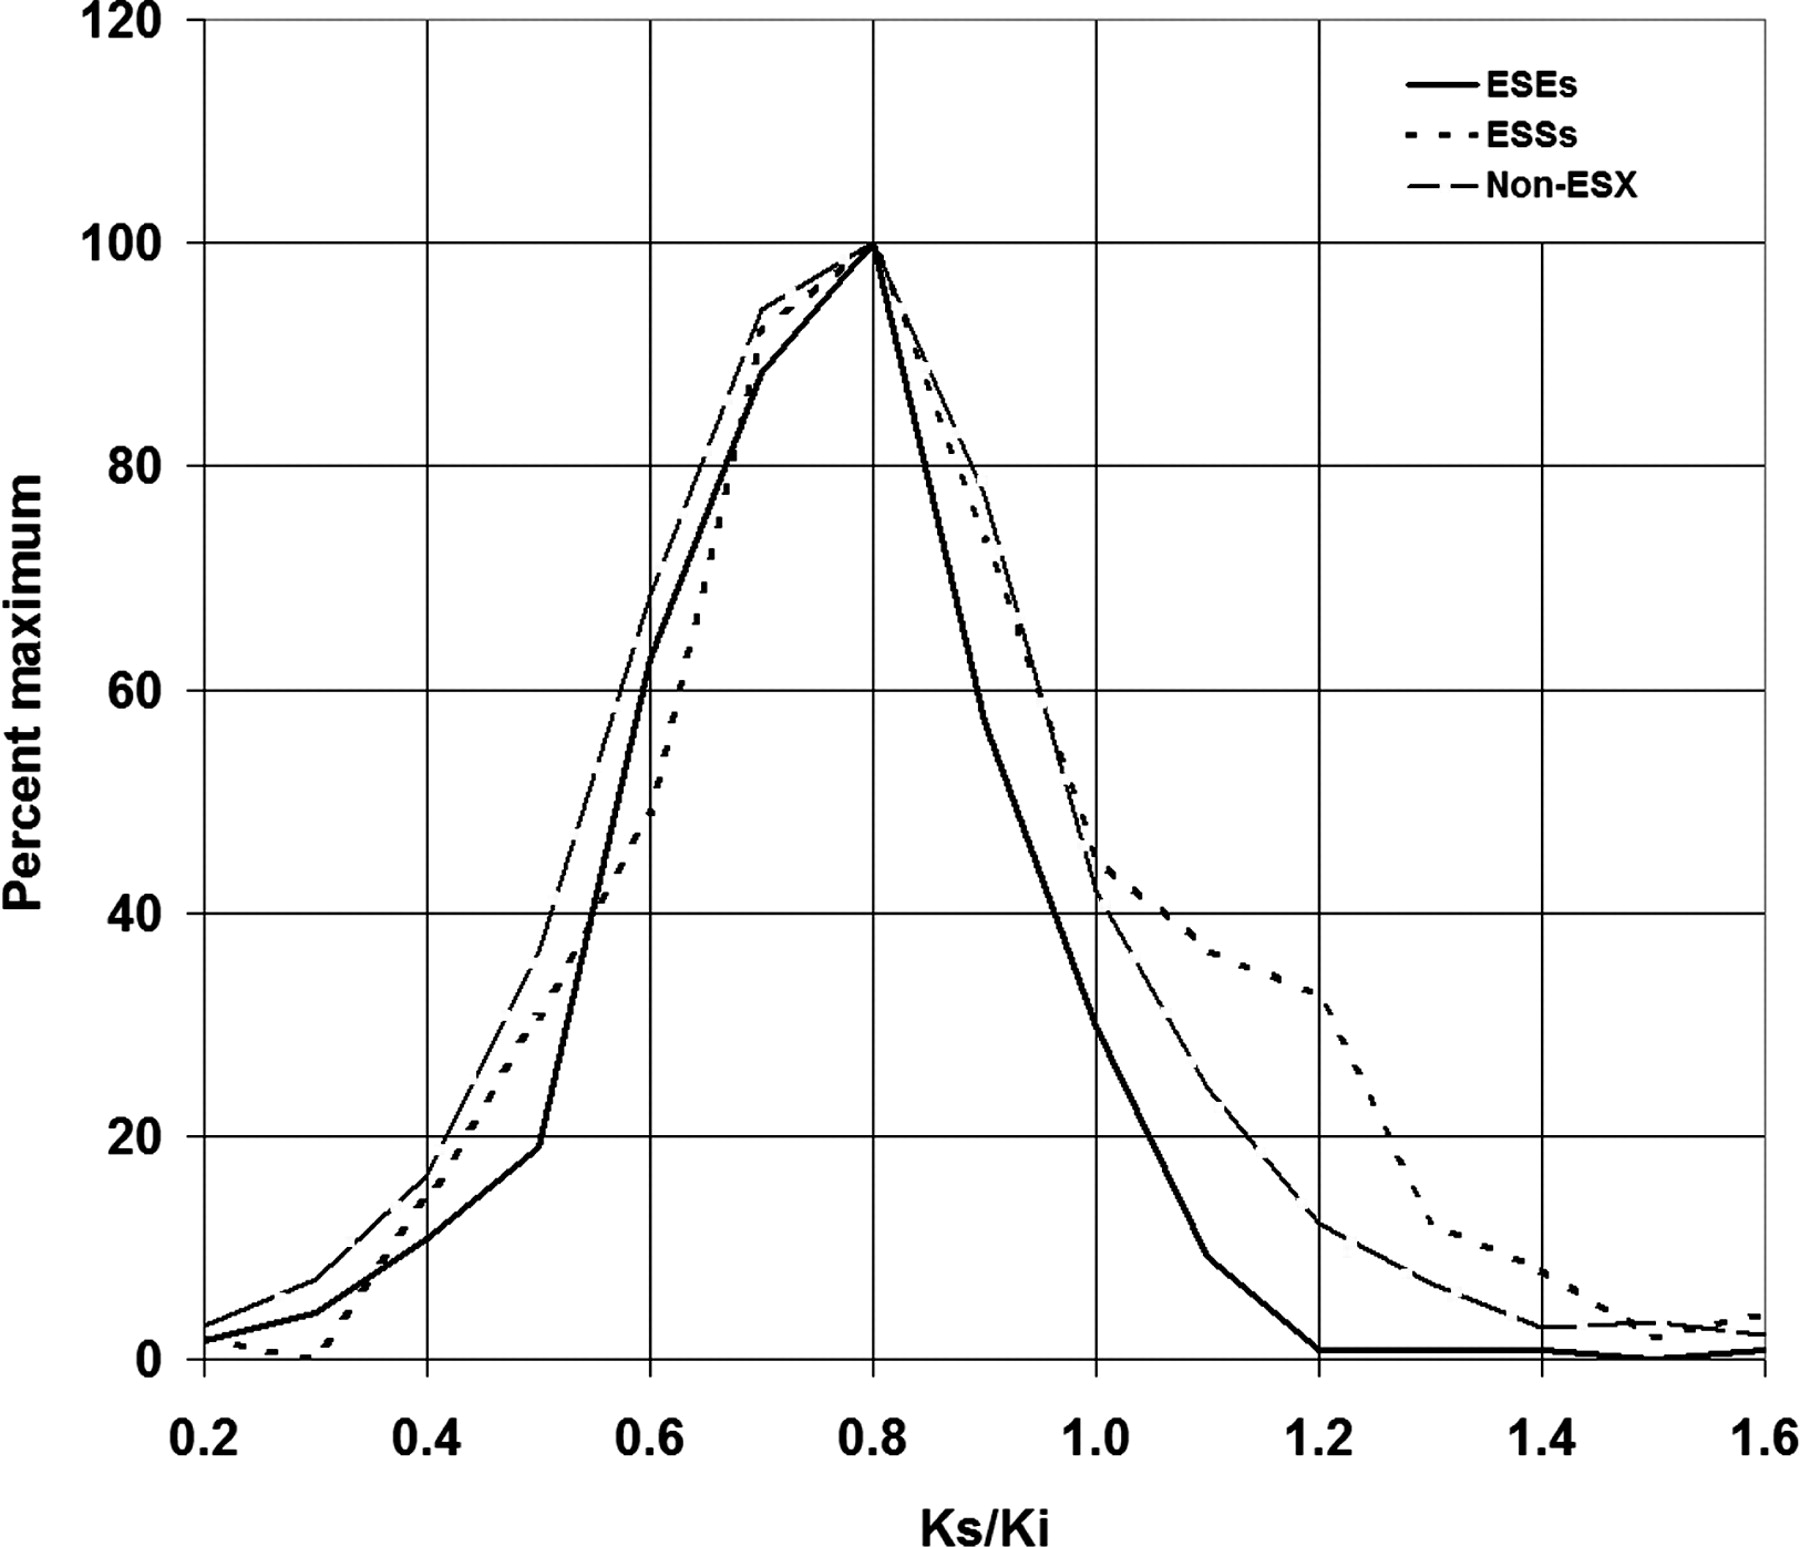
Figure 2.
Distribution of Ks/Ki ratios for hexamers. Histograms of Ks/Ki values for ESEs, ESSs, and remaining hexamers are shown. Data include the full 469 ESE and 246 ESS sets (not purged of reverse complements) and 3448 non-ESXs and exclude changes at CpG sites and 33 mostly CpG-rich hexamers that yielded no data.


