
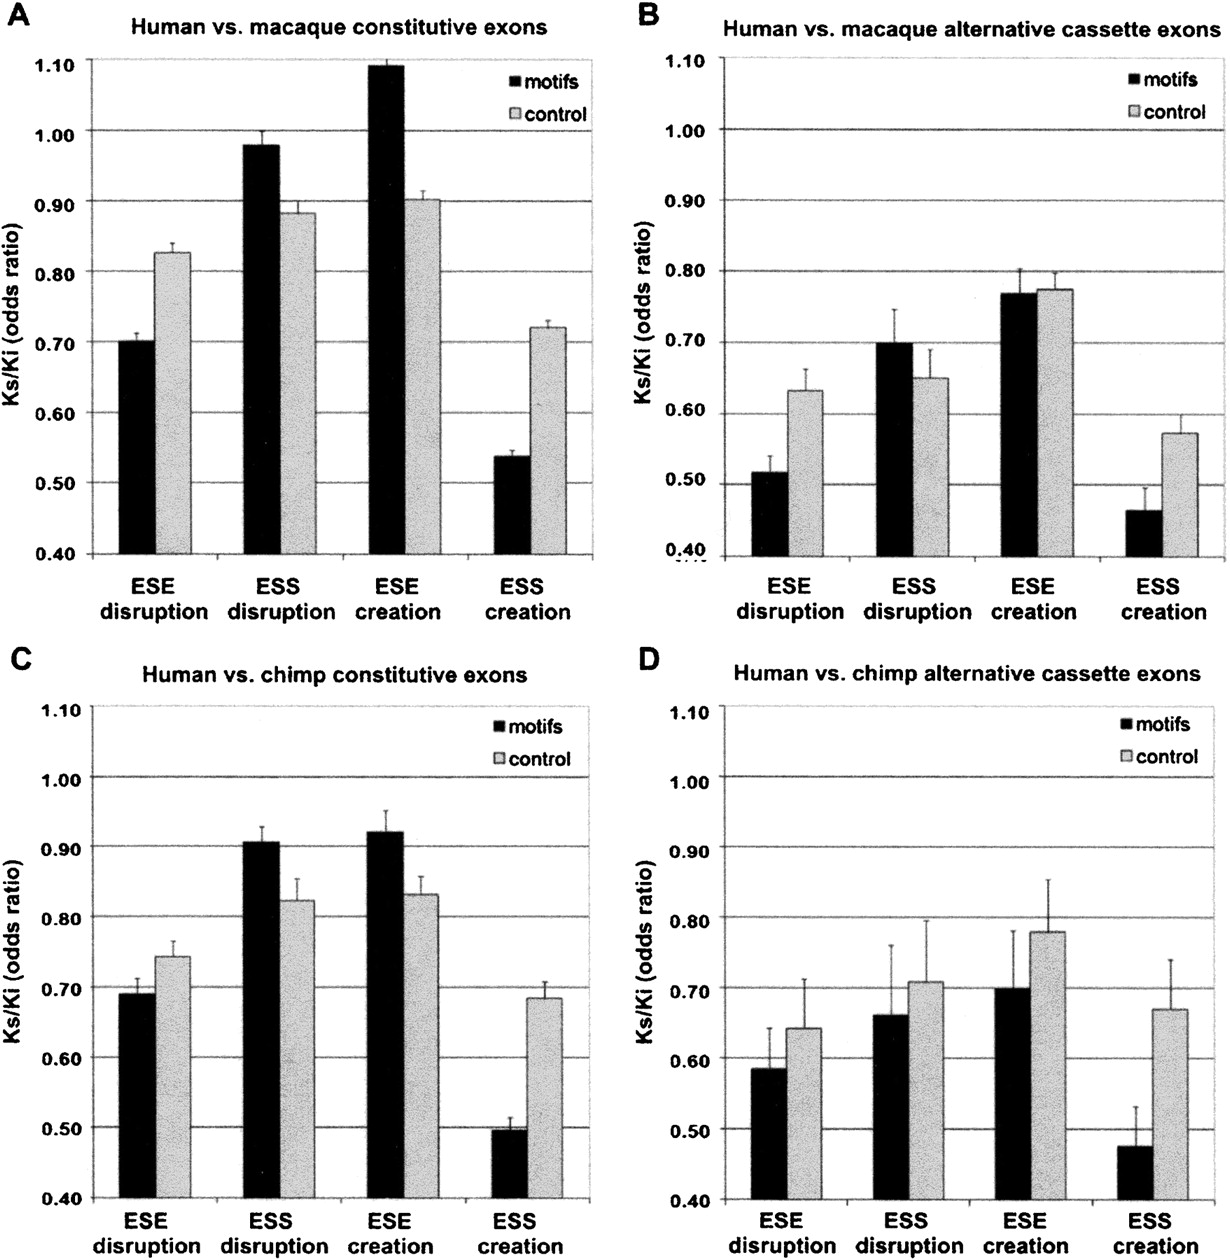
Figure 1.
Rates of ESE and ESS creation and disruption. Rates have been normalized for change at intronic sites, expressed as Ks/Ki. Black bars represent ESE and ESS motifs (but purged of reverse complements); the gray bars represent two separate control motif sets, being largely the reverse complements of the ESE and ESS sets (see text). Error bars show 95% confidence intervals. (A,B) Human–macaque comparisons; (C,D) human–chimpanzee comparisons. (A,C) Constitutive exons; (B,D) alternatively spliced exons.


