
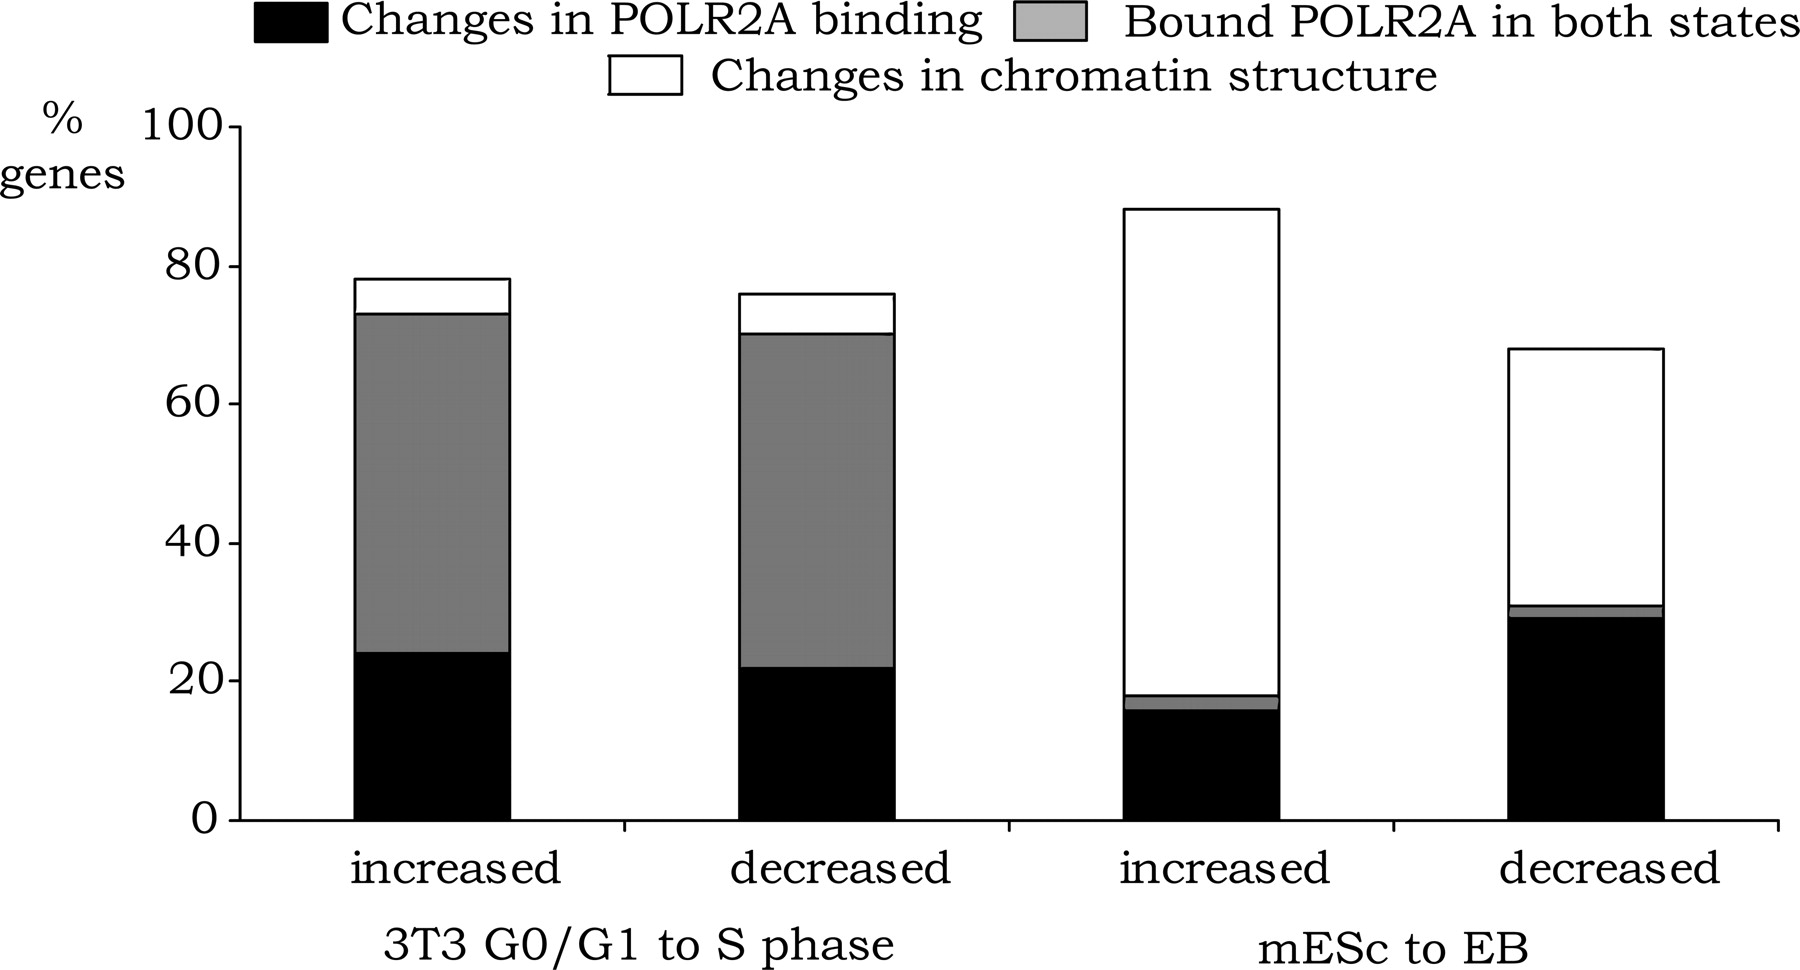
Mechanistic analysis of transitioning populations. The subsets of genes that showed expression changes and a >2000 position change in the target gene list for POLR2A, H3me3K27, H3me3K9, or 5-meC were identified by comparing G0/G1 to S phase 3T3 cells and mESc to EBs. For example, an up-regulated gene in S phase or EBs was required to move 2000 positions higher in the POLR2A list of ranked targets or 2000 positions lower in the H3me3K27, H3me3K9, or 5-meC list. Conversely, a down-regulated gene in S phase or EBs was required to move at least 2000 positions lower in the POLR2A list or 2000 positions higher in the H3me3K27, H3me3K9, or 5-meC list. In addition, we eliminated all genes that were not true targets of each mark (but were simply changing positions in the very bottom of the ranked lists) by requiring that the enrichment value be at least 0.7(on a log2 scale) in the appropriate set. For ease of display of the data, we combined the sets of promoters regulated by changes in H3me3K27, H3me3K9, or 5-meC and identified this set as “regulated by changes in chromatin structure.” We also identified the set of genes that showed changes in RNA levels during the G0 to S phase progression or after differentiation of the mES to EB but which were bound by high levels of POLR2A in both cell states (promoters had a >1.0 [on a log2 scale]), enrichment for POLR2A in both cell states, and lacked silencing marks in either cell state (enrichments <0.7 [on a log2 scale] for H3me3K27, H3me3K9, or 5-meC).


