
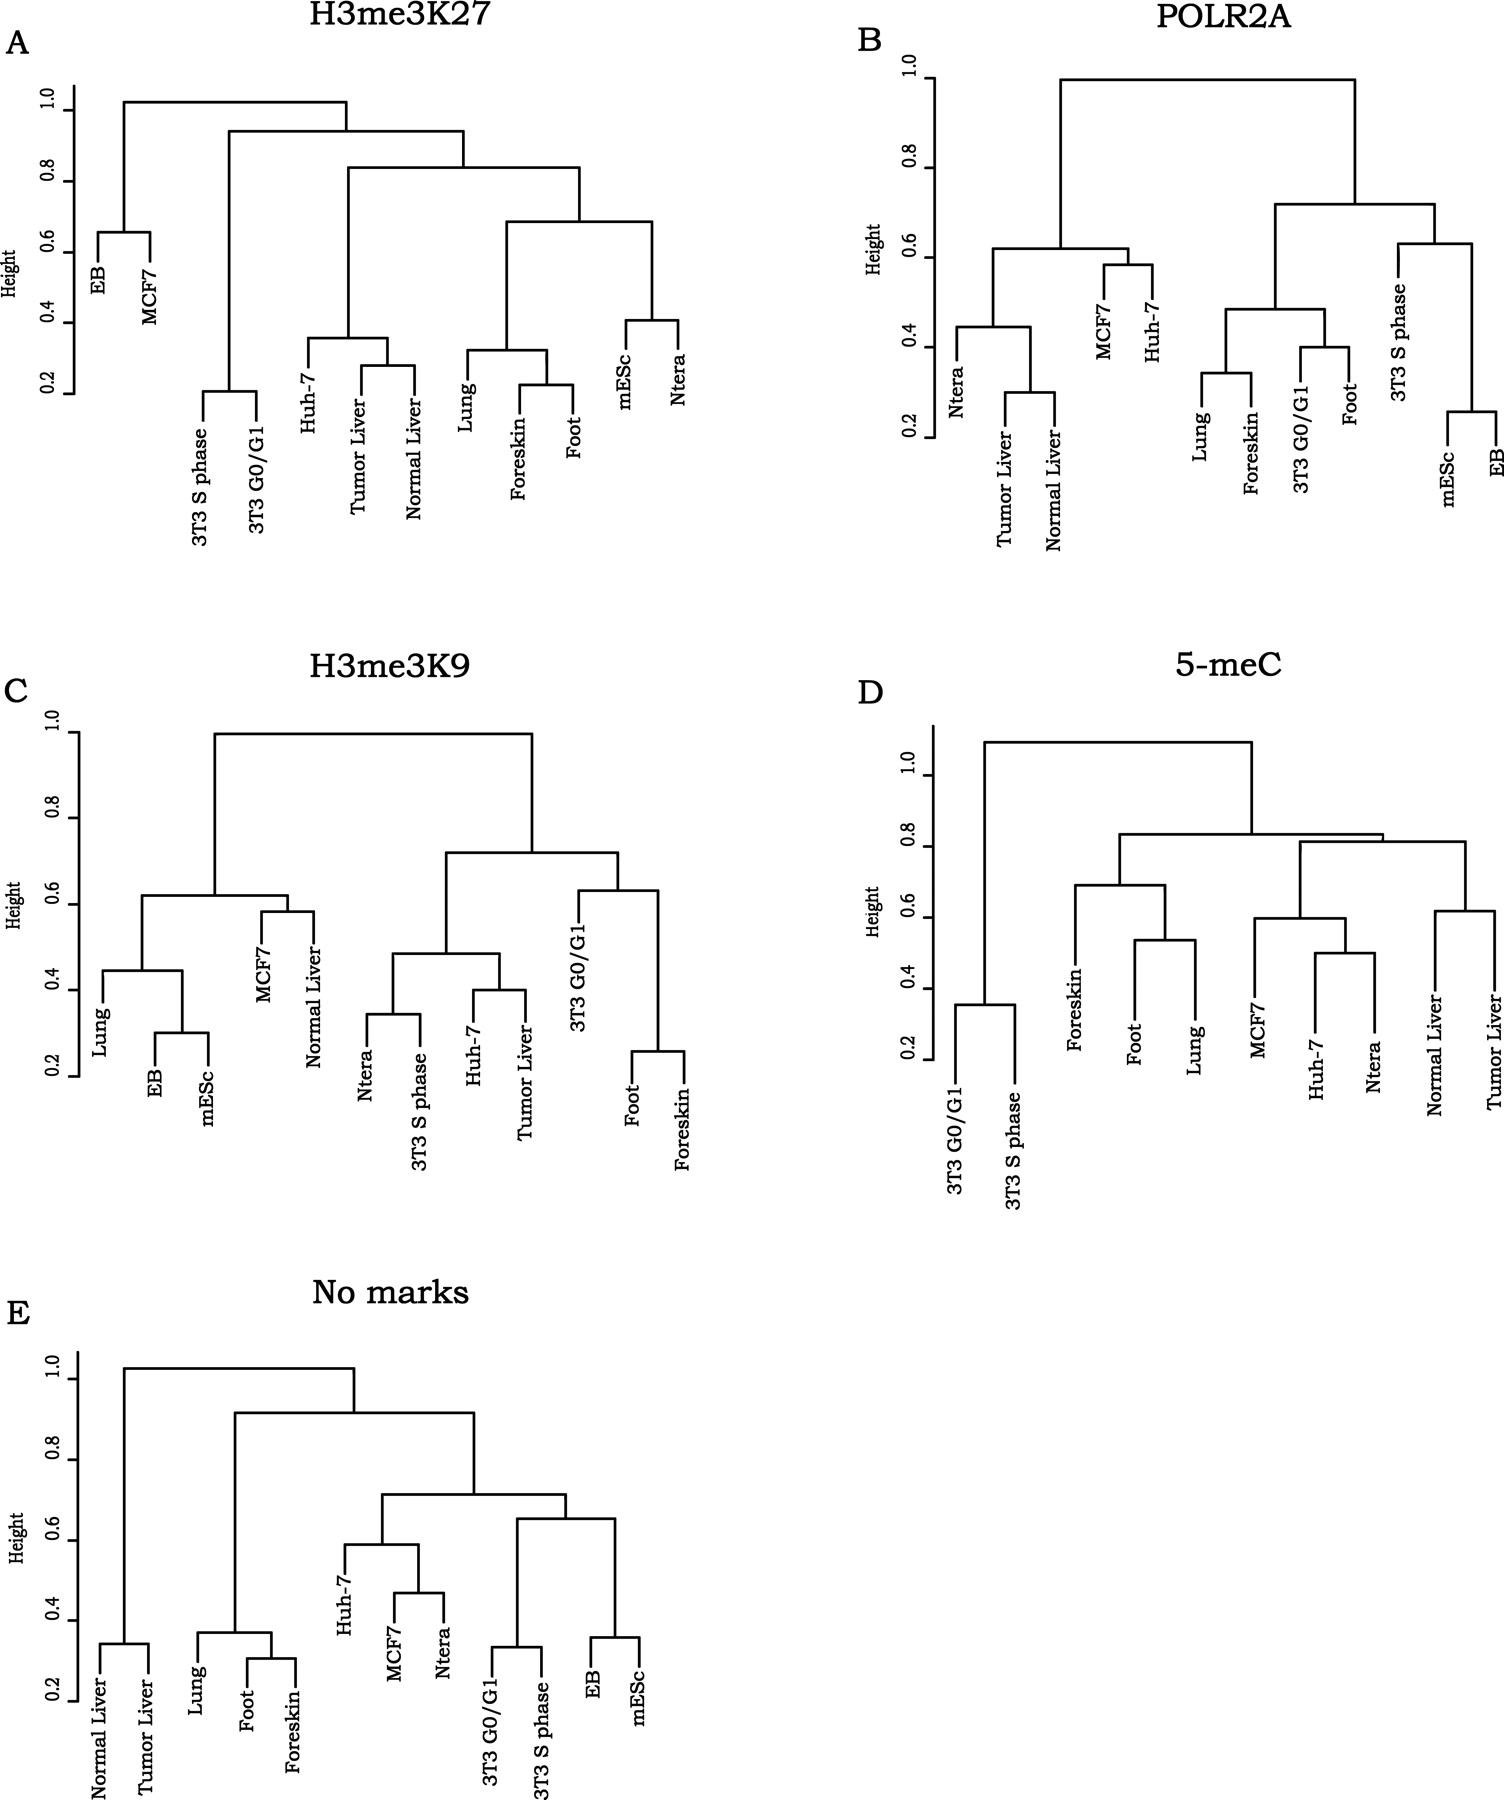
Cluster analysis of gene ontology categories in the sets of LEGS repressed by different mechanisms. The sets of LEGs for each cell population that were bound by H3me3K27 (A), POLR2A (B), H3me3K9 (C), 5-meC (D), or no marks (E) were analyzed using the DAVID gene ontology program. The functional annotations that passed the cutoff criteria (see Methods) for each cell population were compared by transforming the lists into a binary data set (if a functional category was present, then its P-value was assigned to 1; if it was absent, then its P-value was assigned to 0). We then performed hierarchical cluster analysis and plotted the dendograms in R (http://www.R-project.org) using hclust function.


