
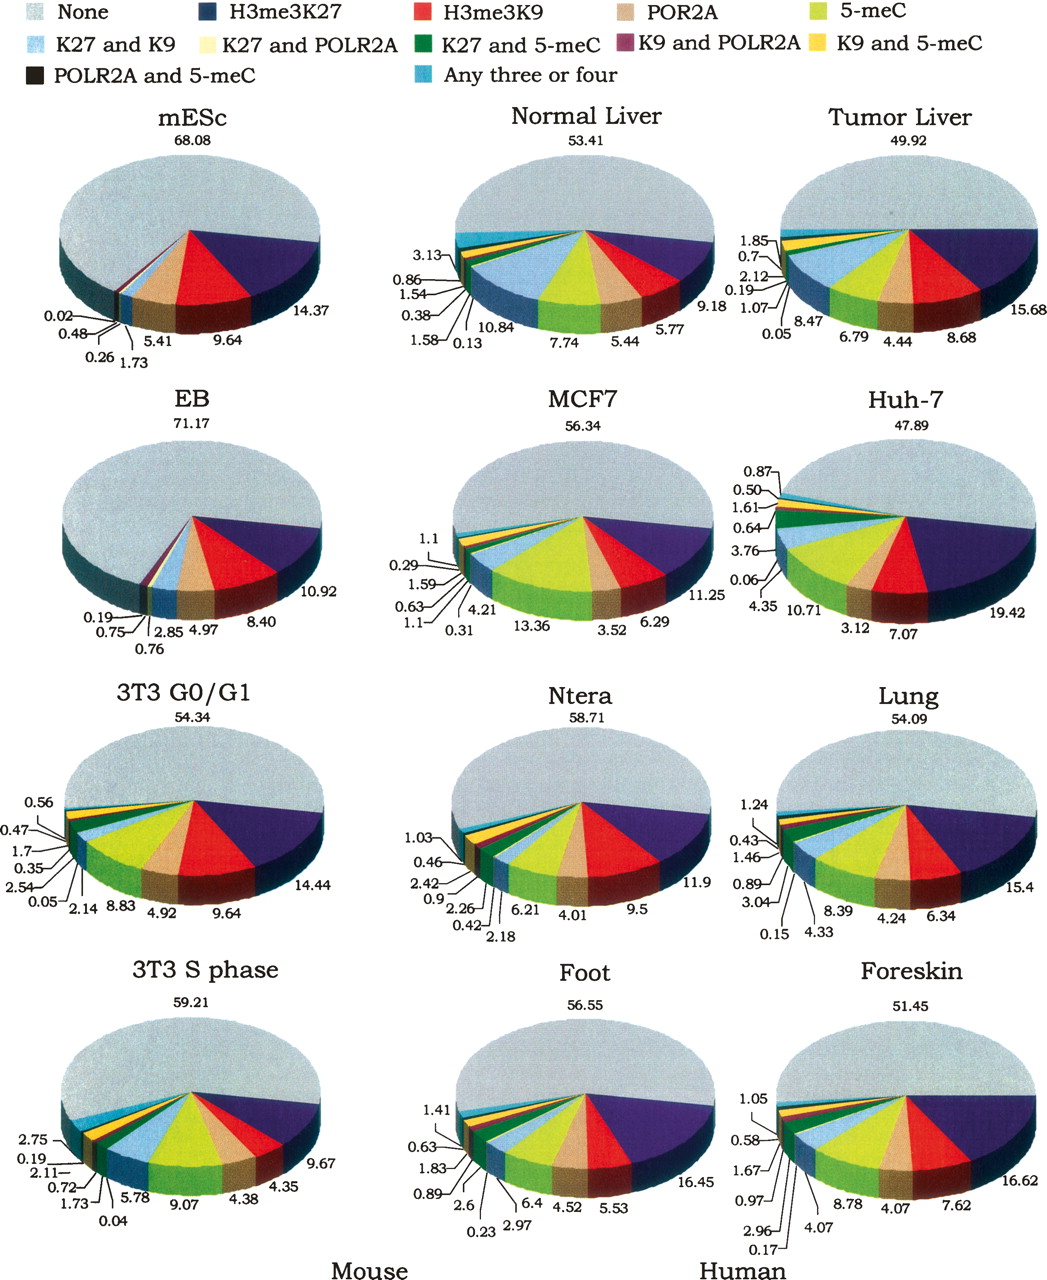
Figure 3.
Promoters are generally repressed by a single mechanism. Shown are pie charts indicating the percentage of LEGs that are bound by only one of the repression marks, by each of the possible different combinations of two marks, or by any three or four marks; also shown is the percentage of LEGs that are not bound by any of the repression marks.


