
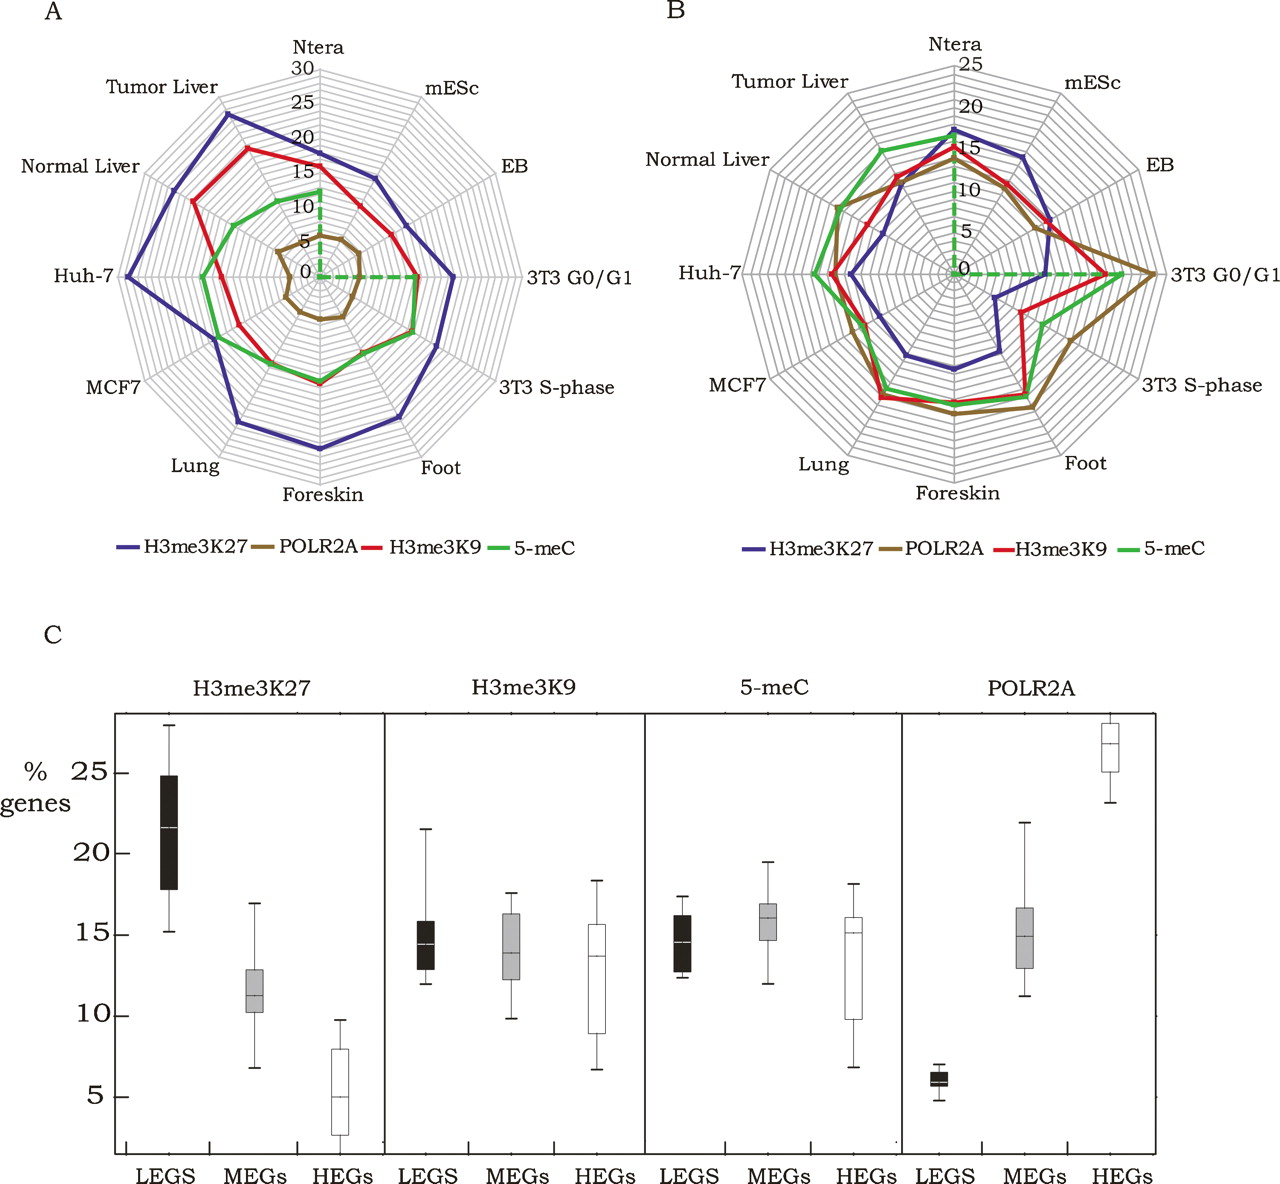
Figure 2.
Comparison of repression mechanisms for 12 cell types. The percentage of LEGs (A) or MEGs (B) bound by H3me3K27, POLR2A, H3me3K9, or 5-meC is shown for each of the 12 cell populations. In panel C, box and whisker plots demonstrate the utilization of the four different marks in all 12 cell populations as shown for LEGs, MEGs, and HEGs. The upper and lower quartiles of the box plots are the 75th and 25th percentiles, respectively. The whisker top and bottom are 90th and 10th percentiles, respectively.


