
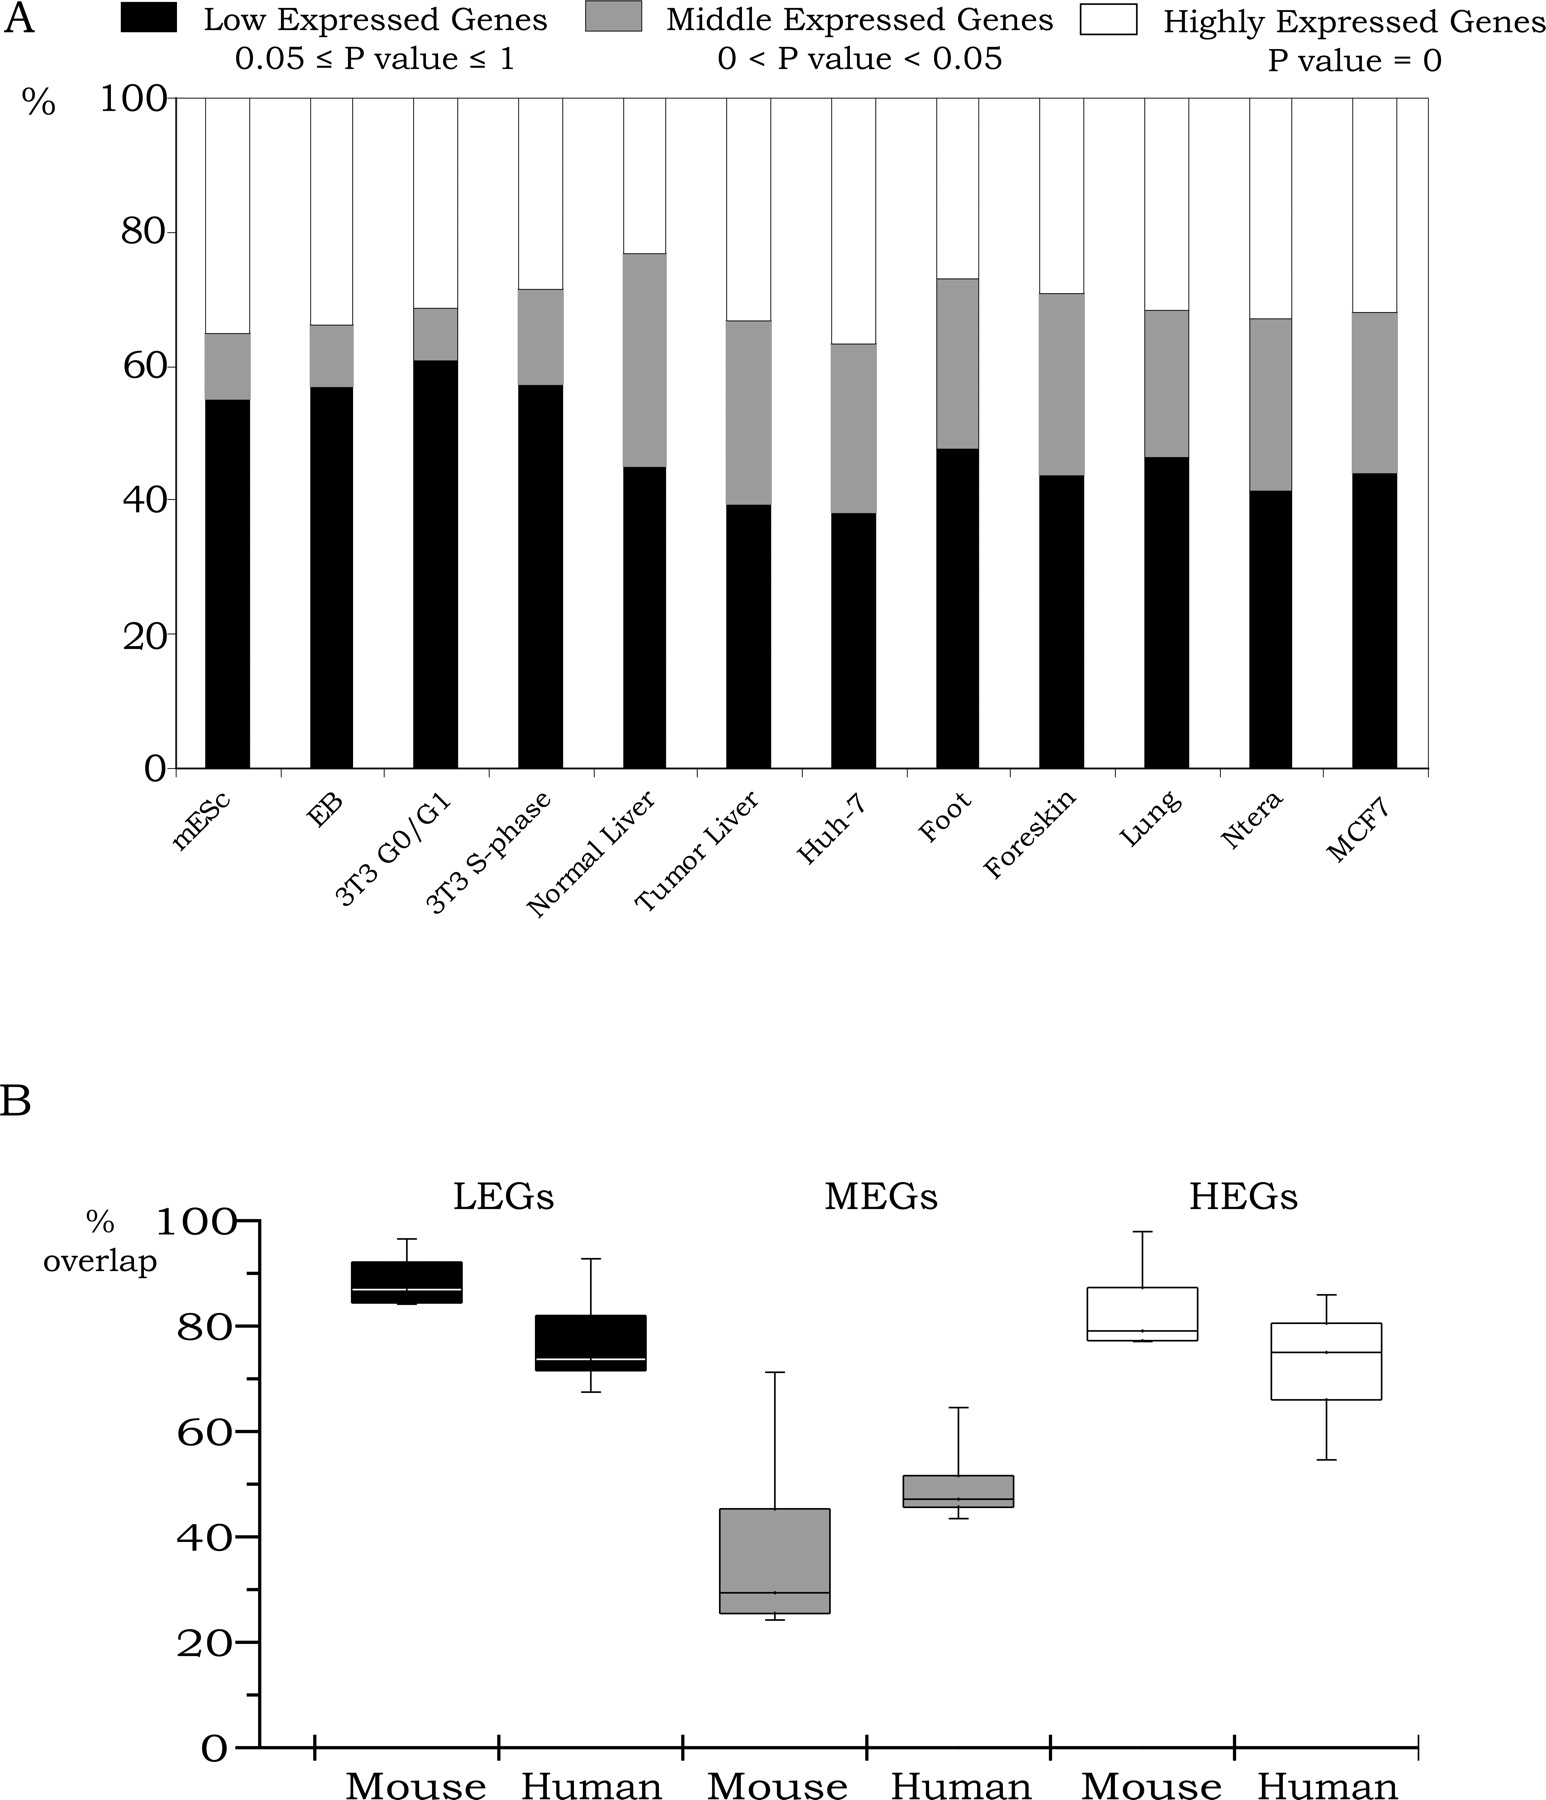
Transcriptome analysis of 12 cell populations. (A) Identification of LEGs, MEGs, and HEGs. Illumina BeadChip arrays were used to analyze RNA from the 12 cell populations. The RNAs were then classified into low expressed genes (0.05 ≤ P-value ≤ 1), middle expressed genes (0 < P-value < 0.05), and highly expressed genes (P-value = 0). Percentages of the LEGs, MEGs, and HEGs are shown relatively to the total number of genes on the Illumina platform for all 12 cell populations. (B) Comparison of different cell populations. All possible pairwise comparisons between the genes in each category (the sets of LEGs, MEGs, and HEGs) were made, and then the percentage overlap was calculated relative to the average number of genes in each category. The upper and lower quartiles of the box plots are the 75th and 25th percentiles, respectively. The whisker top and bottom are 90th and 10th percentiles, respectively.


