
Figure 2.
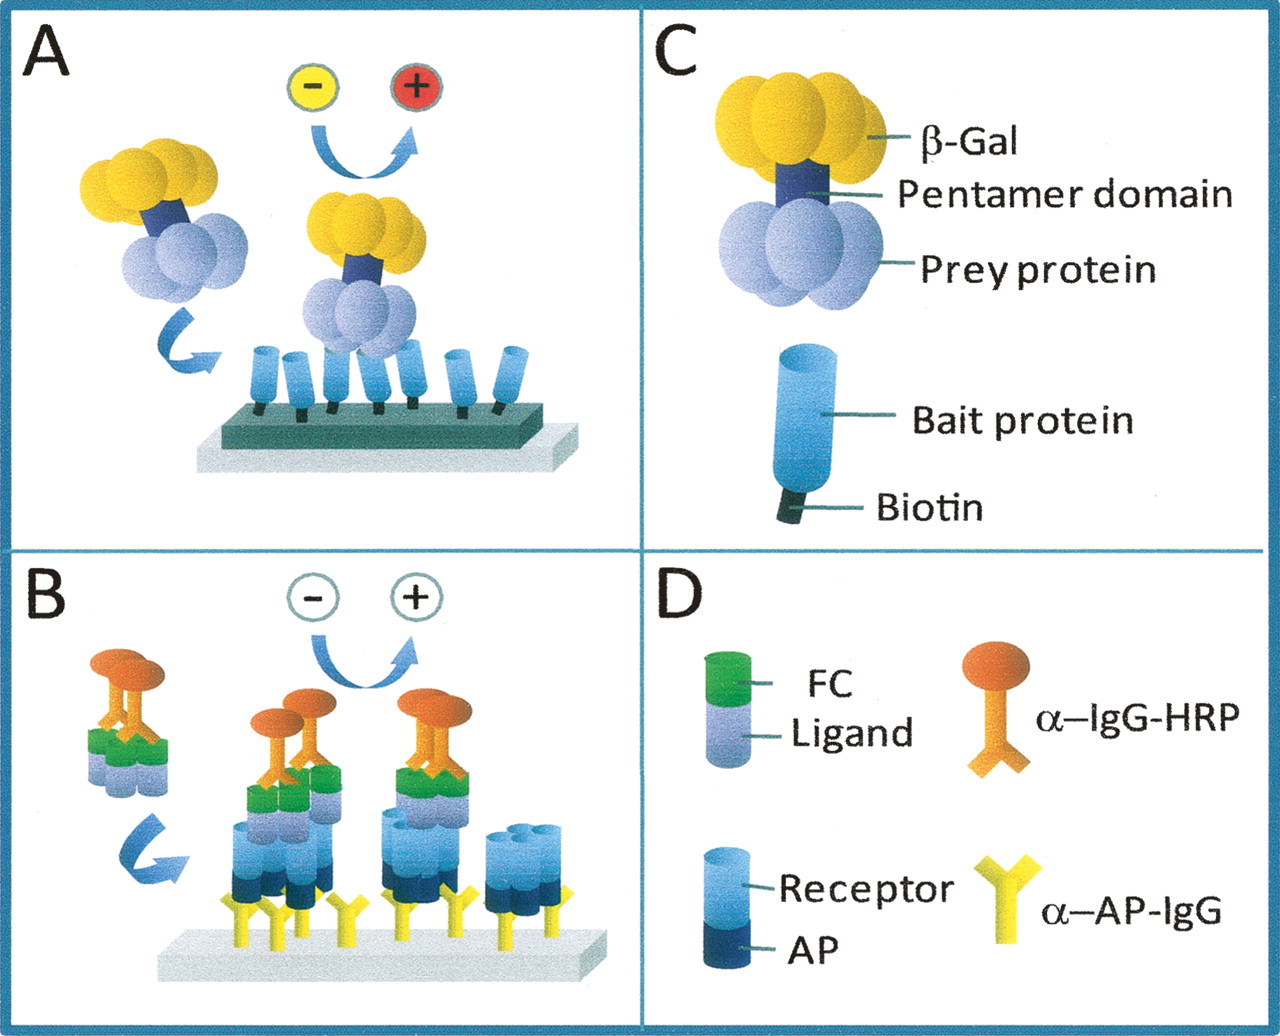
Diagrammatic representation of the AVEXIS (A) and DSCAM (B) assay. A description of the molecular reagents used in each assay system is shown in panels C and D.
(Downloading may take up to 30 seconds. If the slide opens in your browser, select File -> Save As to save it.)
Click on image to view larger version.
Diagrammatic representation of the AVEXIS (A) and DSCAM (B) assay. A description of the molecular reagents used in each assay system is shown in panels C and D.
 CiteULike
 Delicious
 Digg
Digg Facebook
 Google+
 Reddit
 Twitter
