
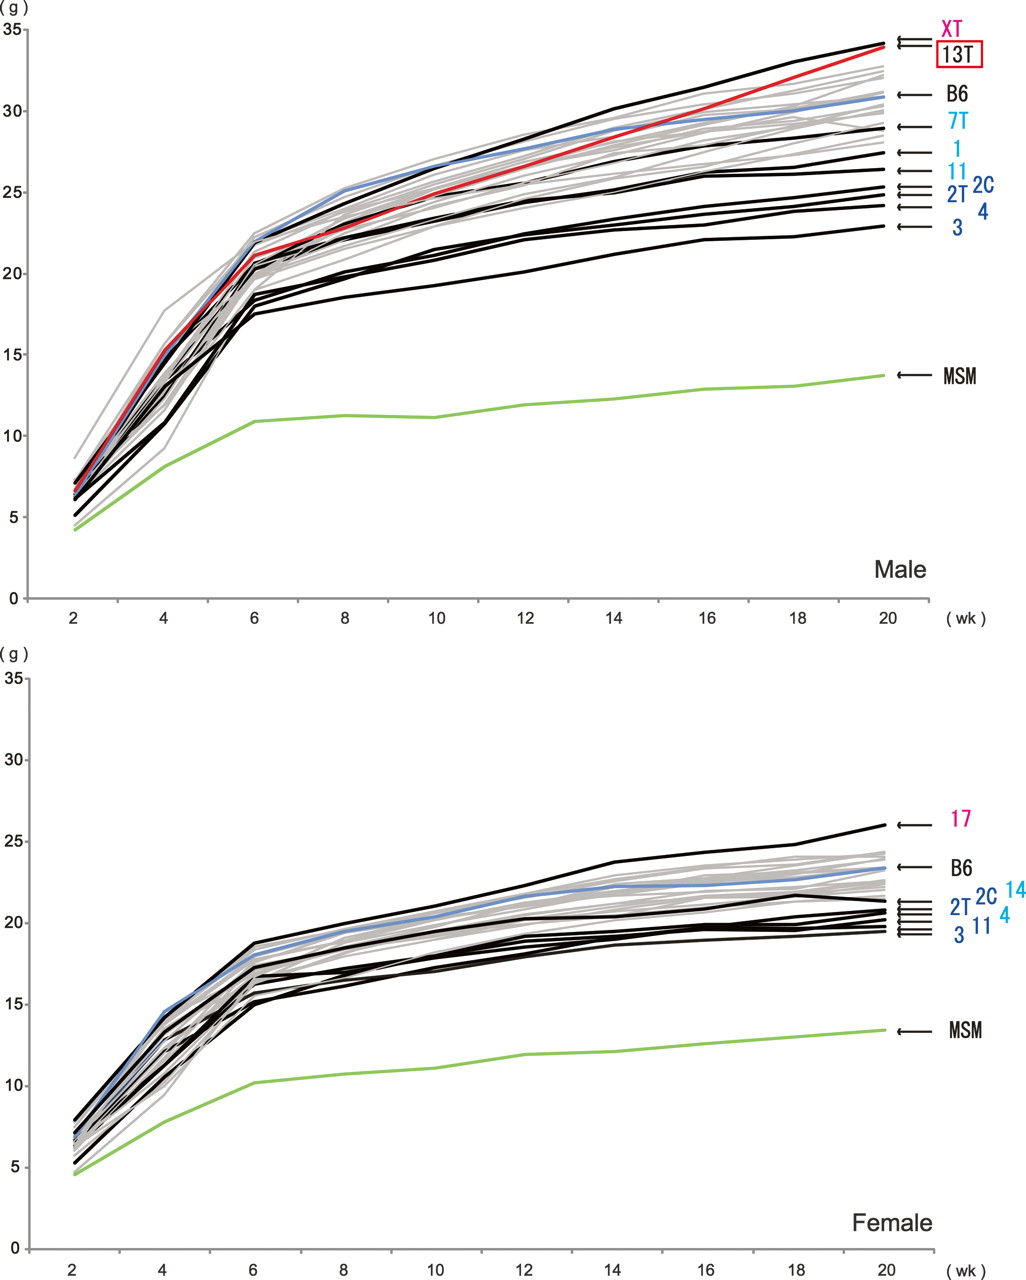
Figure 3.
Growth of consomic strain mice. Every 2 wk, from 2 to 20 wk of age, the body weight of mice from each consomic strain (B6 and MSM/Ms) was measured, and the mean value of each strain was plotted. The bold line denotes a growth curve that deviates significantly from that of B6. The names of consomic strains with statistically significant differences in body weight at 20 wk of age are shown, with color-coding as described for Figure 2. The red line denotes the growth curve of B6-Chr13TMSM, for which the highest rate of growth was between 10 and 20 wk of age.


