
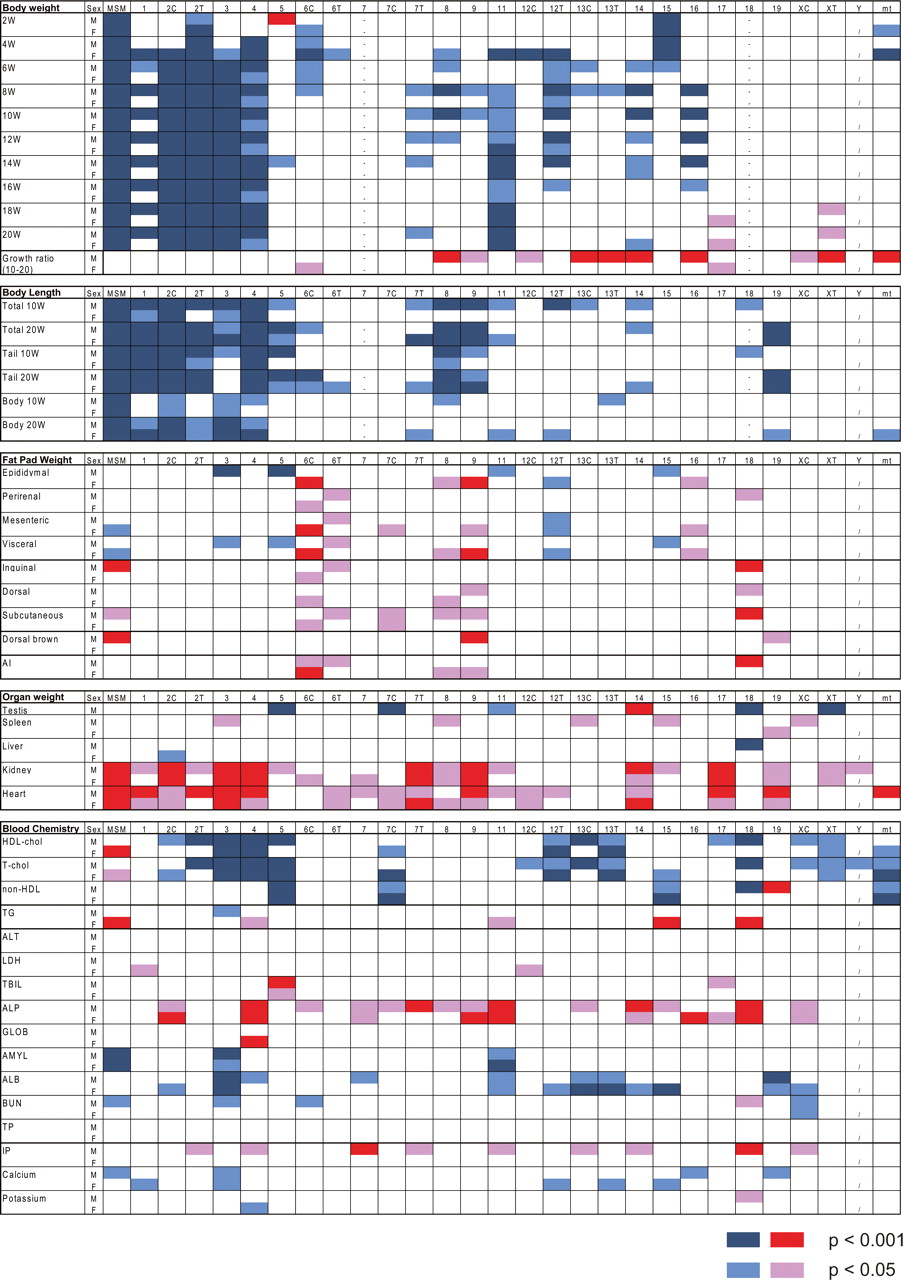
Figure 2.
Summary of comprehensive phenotyping of the consomic panel. The upper half of each box indicates the result obtained in males, and the lower half, the result in females. Red and magenta boxes indicate values larger than those of the host B6 strain. Highly significant values (P < 0.001) are shown in red, and all other statistically significant values (P < 0.05) are shown in magenta. Dark blue and light blue boxes indicate values lower than those of B6. Highly significant values (P < 0.001) are shown in dark blue, and all other statistically significant values (P < 0.05) are shown in light blue.


