
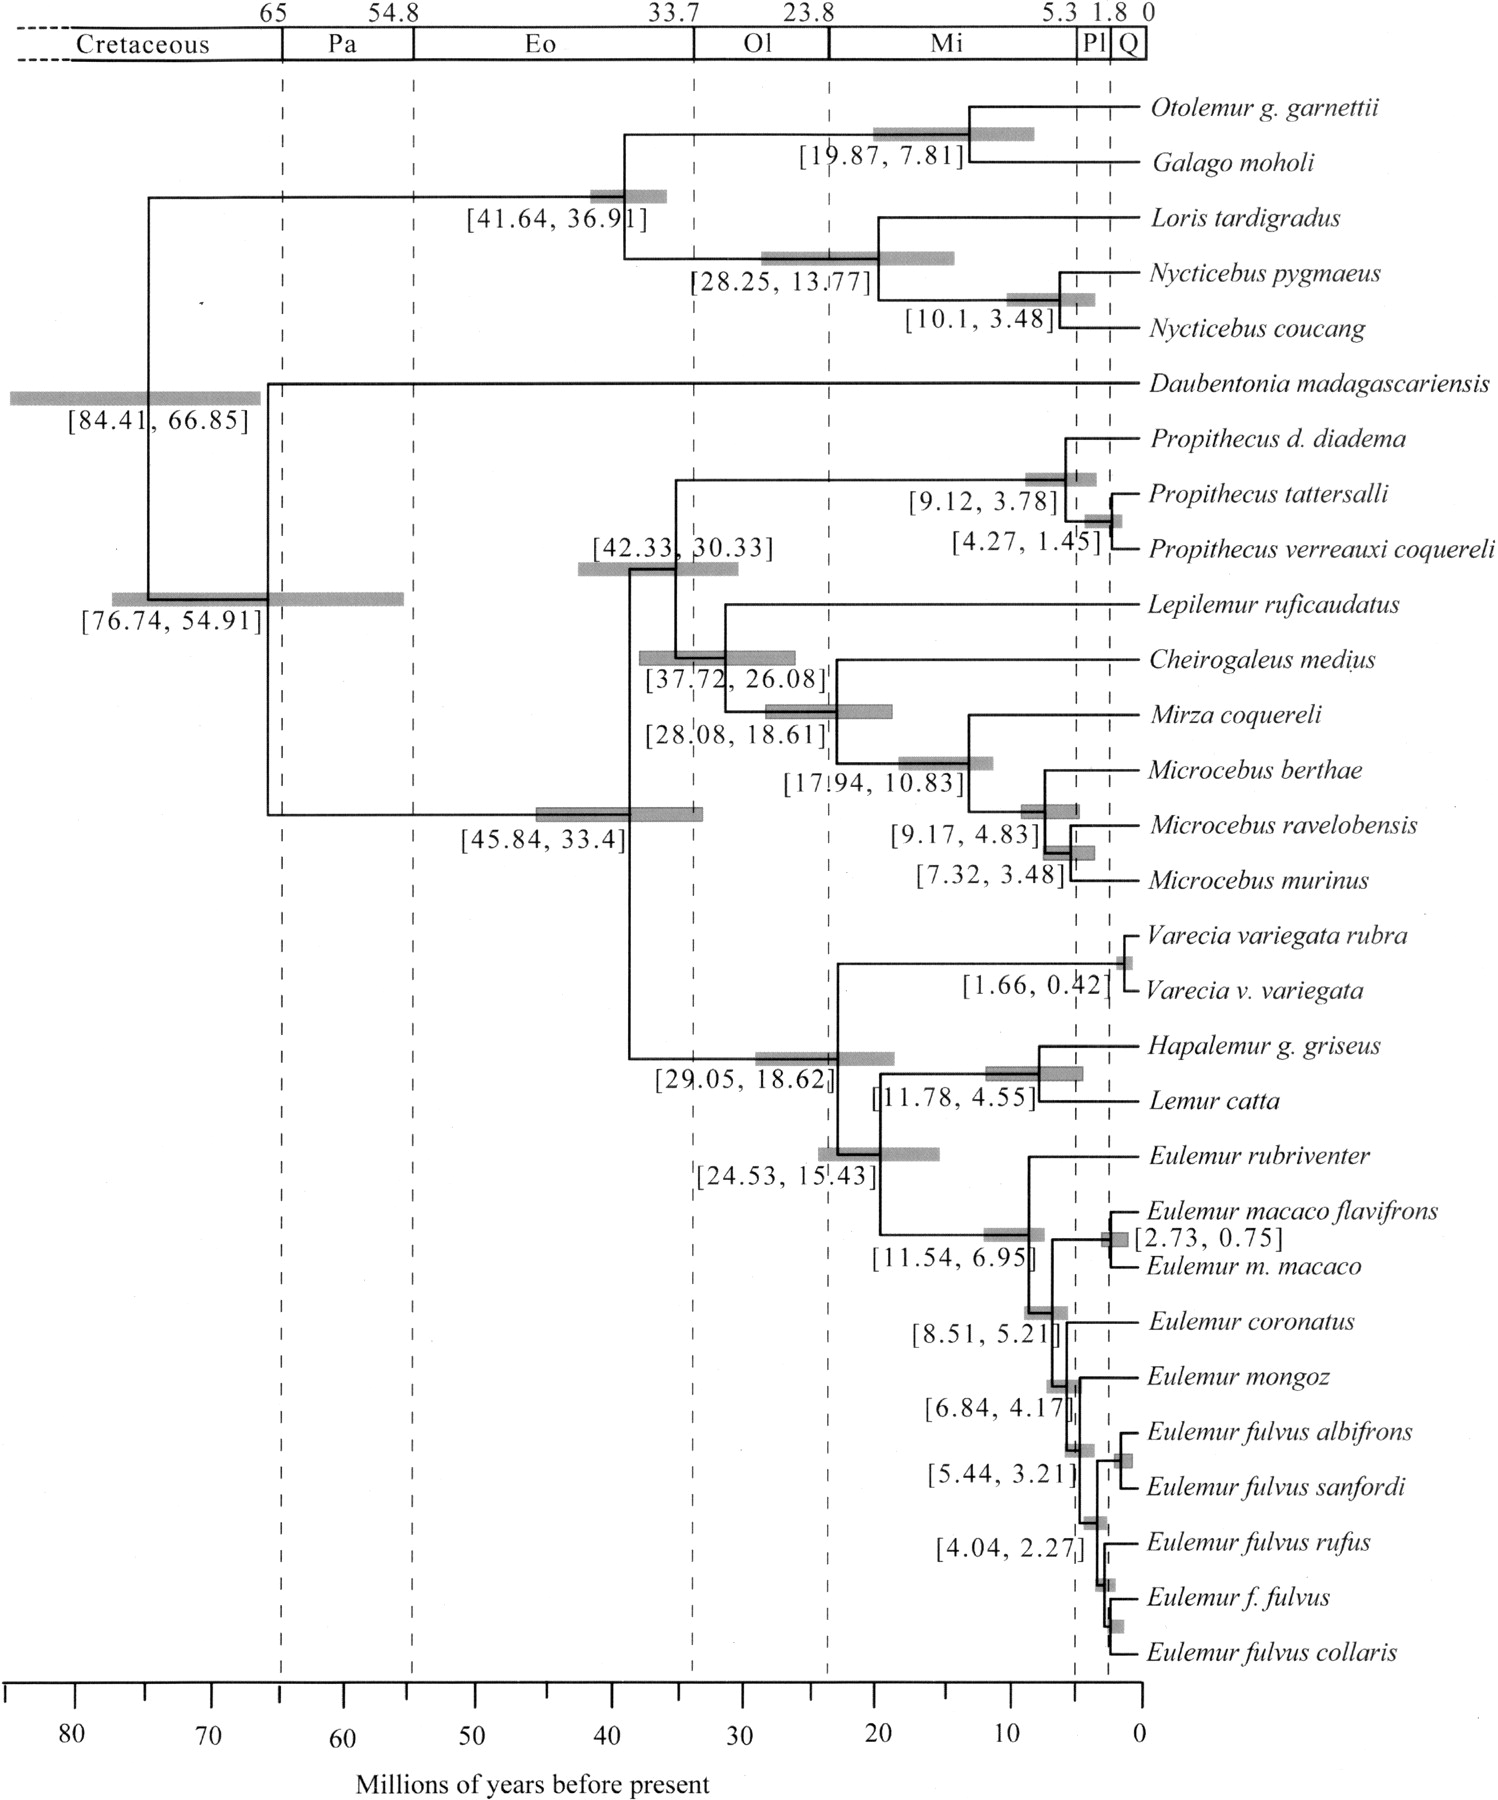
Divergence time estimates for the strepsirrhine lineages. An ultrametric tree with divergence time estimates resulting from the combined posterior distribution of four independent BEAST analyses (see Methods) of the combined nuclear data set. The results are based on prior date estimates of (1) the 6 Mya (5–7 Mya) split between Homo sapiens and Pan troglodytes (Kumar et al. 2005) and (2) the 40 Mya (38–42 Mya) split between the Lorisidae and Galagidae (Seiffert et al. 2003). Shaded gray boxes and numbers within brackets span the 95% highest posterior density of divergence time estimates. The scale bar is divided up by time (in millions of years before present) according to the Cretaceous, Tertiary, and Quaternary periods. The Tertiary period is shown according to epochs (Pa indicates Paleocene; Eo, Eocene; Ol, Oligocene; Mi, Miocene; Pl, Pliocene). Full details of time estimates from all BEAST analyses are presented in Table 4.


