
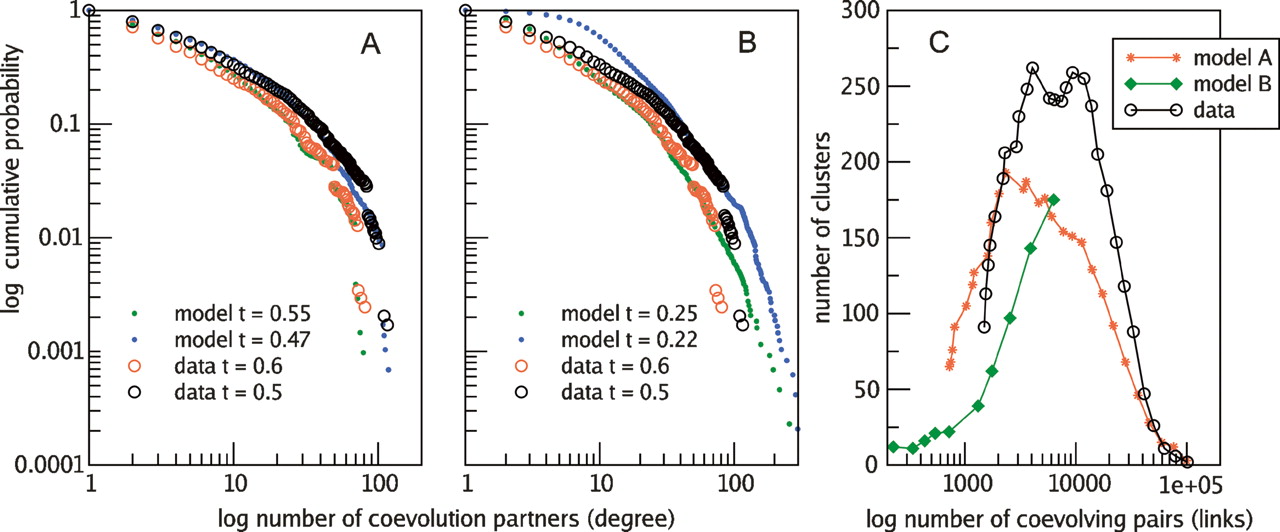
Figure 2.
Global properties of the coevolution map. (A,B) Similar degree distributions as seen in the data can be obtained for simulations of genome evolution, even for the most relaxed conditions, when only the number of events and the tree structure is maintained (low resemblance). In the high resemblance case, the simulation shows similar clustering behavior at a lower level (C), while the low resemblance simulation has almost no connections for high correlations and therefore no clustering. The compared networks were selected for having similar numbers of edges.


