
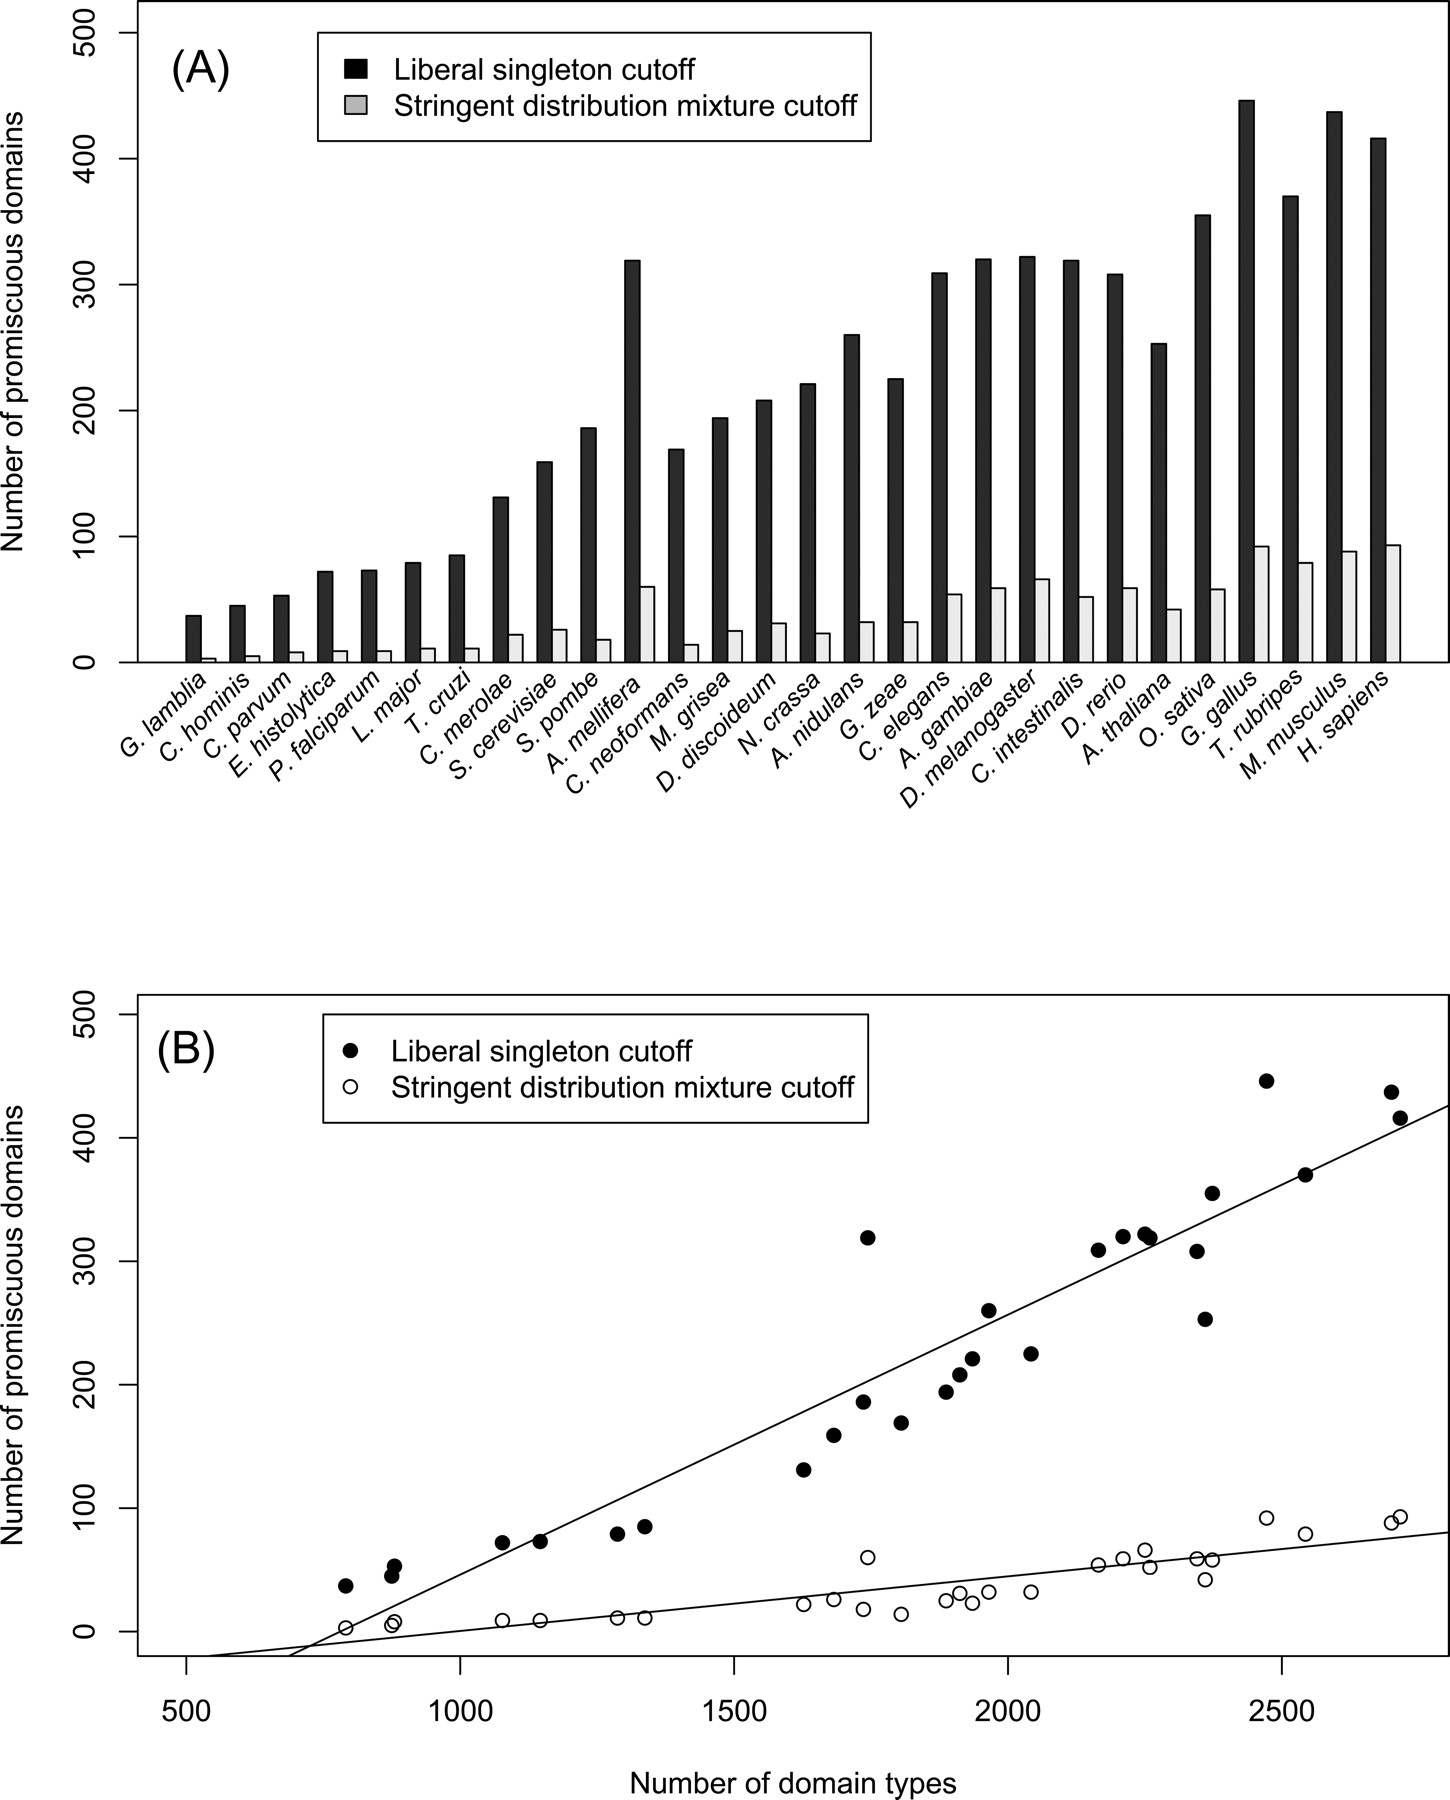
Distribution of promiscuous domains in eukaryotes. (A) Promiscuous domains in the analyzed eukaryotic species. (Black bars) Promiscuous domains defined using weighted bigram frequency with the cutoff determined by the liberal singleton method; (gray bars) promiscuous domains defined using the strict distribution mixture criterion (see text for details). (B) The number of promiscuous domains (on the Y-axis) increases with the number of unique domain types (on the X-axis). (Black circles) Promiscuous domains determined by the liberal singleton cutoff method (Pearson’s correlation 0.94, P-value 4.4 × 10⁻¹⁴); (empty circles) promiscuous domains determined with the strict distribution mixture criterion (Pearson’s correlation 0.88, P-value 4.6 × 10⁻¹⁰).


