
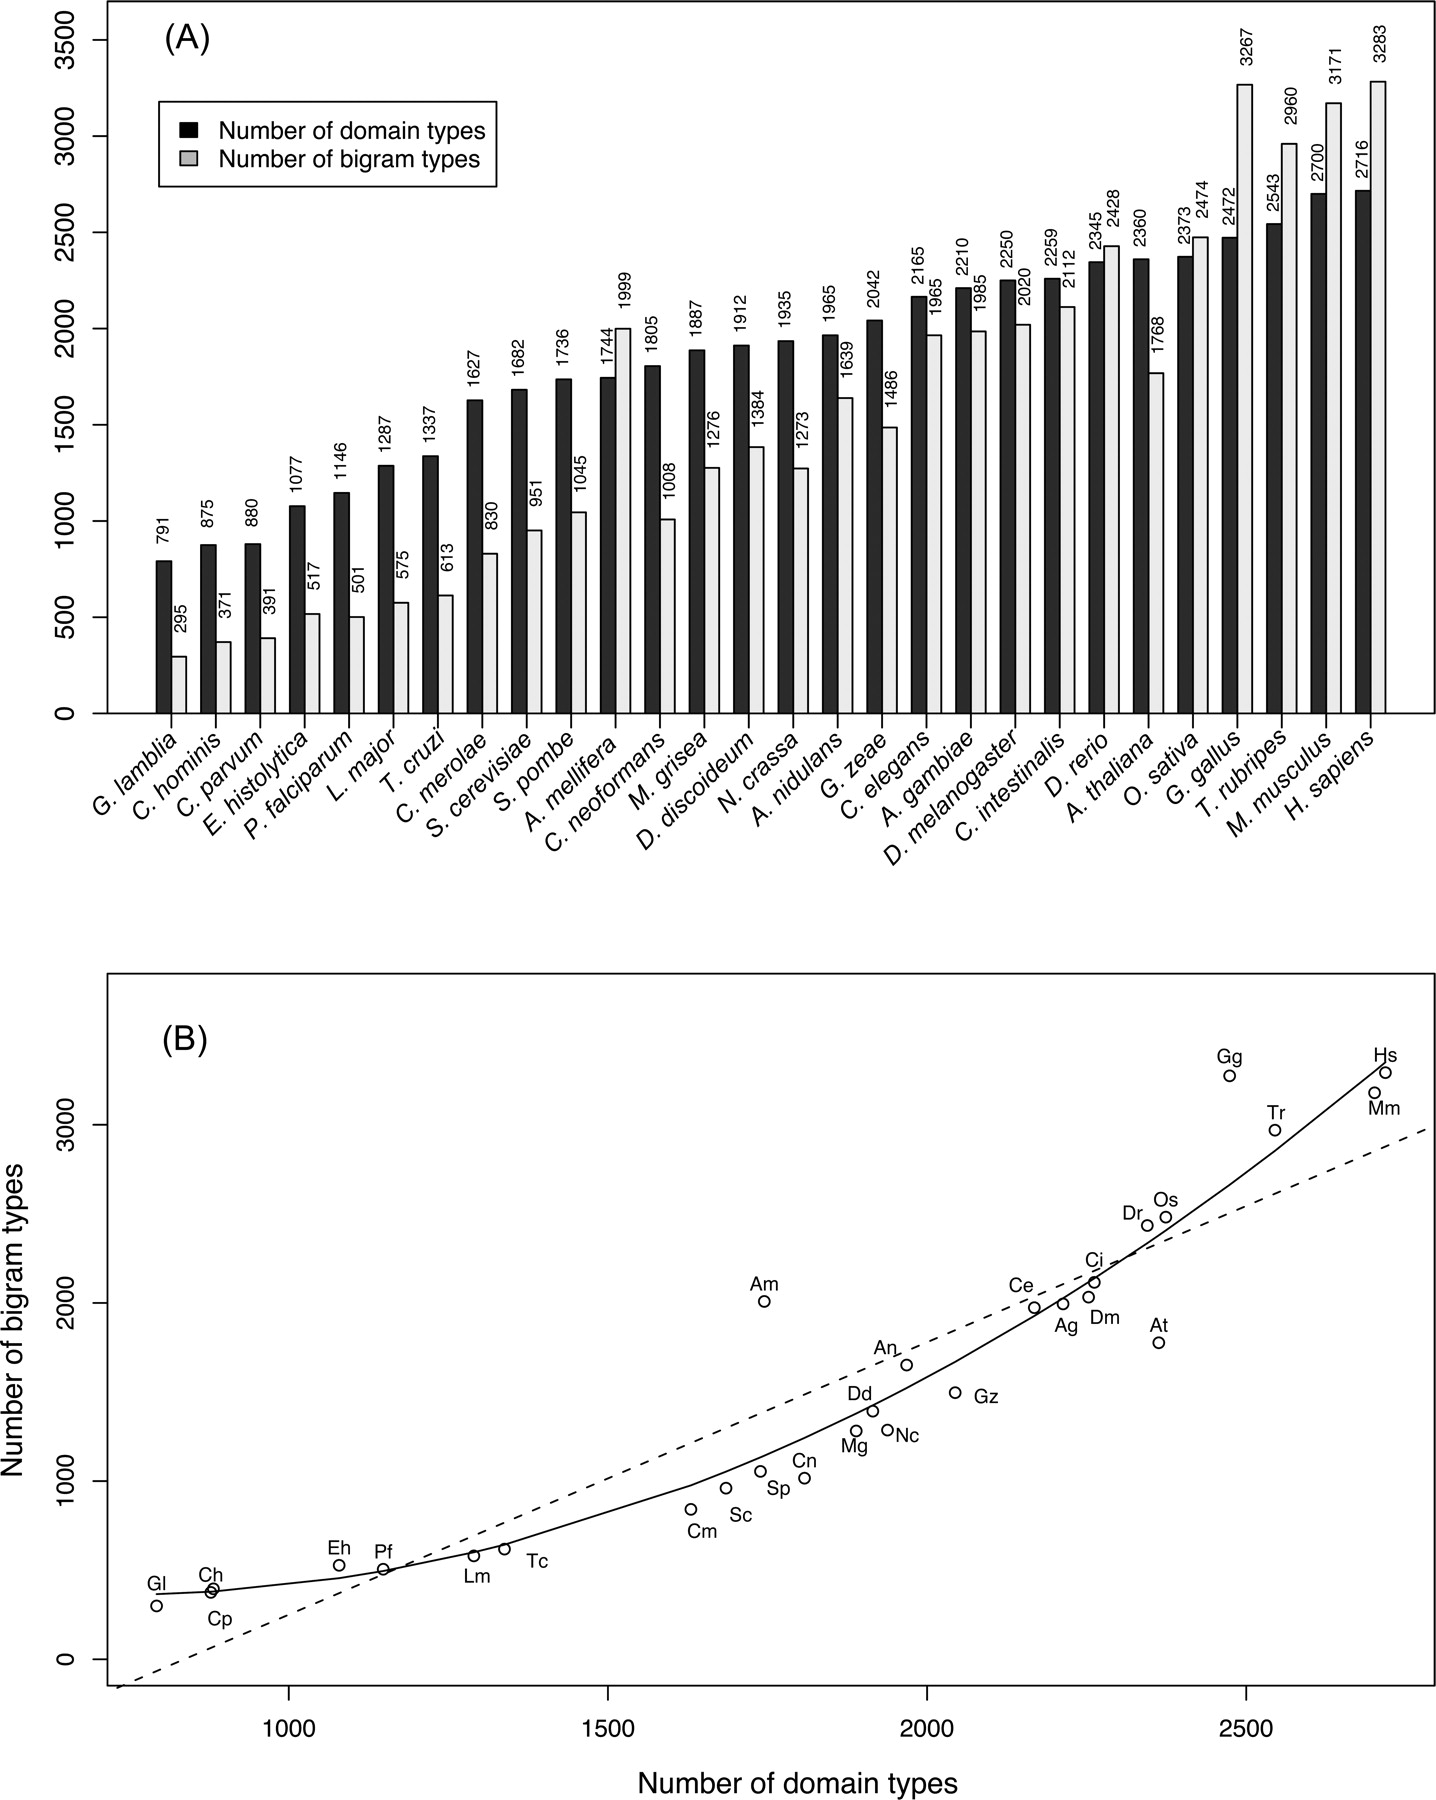
Figure 1.
(A) The counts of distinct domain types and distinct bigram types in the analyzed species. (B) The dependence of the number of bigrams types on the number of domain types encoded in a genome. The linear (dotted) and quadratic (solid) regression lines are shown. The quadratic function is a better fit than the linear function (Pearson’s product-moment correlation: 0.92; P-value ∼ 0.005). Each point is labeled with the species abbreviations as described in Methods.


