
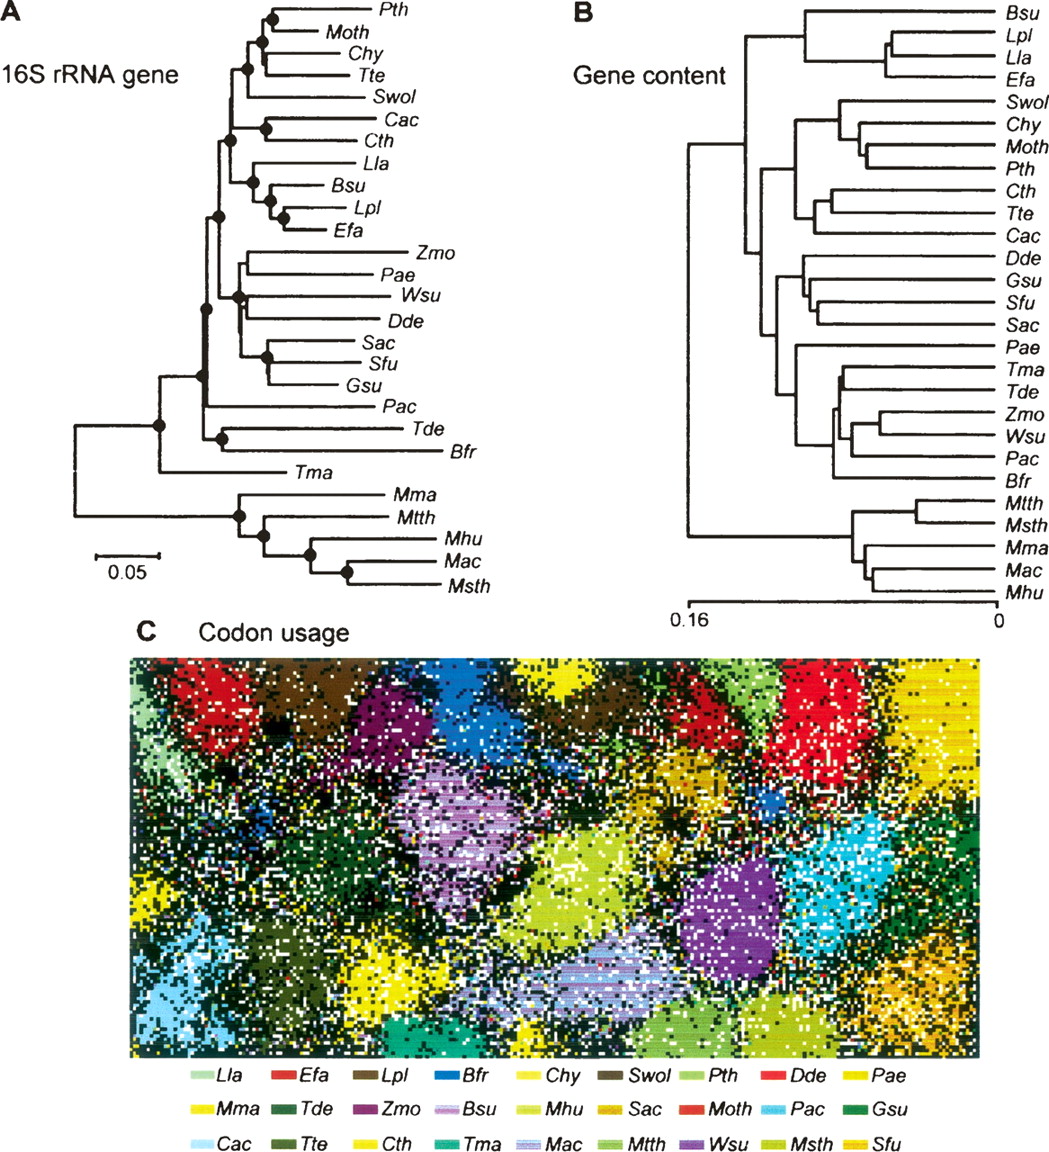
Evolutionary relationships among the organisms analyzed in this study. (A) A neighbor-joining tree based on 16S rRNA gene sequences. (Black circles) Branch nodes supported by the Bootstrap analysis (>70%). (B) A UPGMA tree based on gene contents. (C) A self-organization map (SOM) based on codon usages. Each point represents one CDS, and CDSs of one organism are presented with the same color. Italic letters indicate organism names; (Chy) Carboxydothermus hydrogenoformans; (Lla) Lactococcus lactis; (Lpl) Lactobacillus plantarum; (Efa) Enterococcus faecalis; (Bsu) Bacillus subtilis; (Wsu) Wolinella succinogenes; (Dde) Desulfovibrio desulfuricans; (Gsu) Geobacter sulfurreducens; (Zmo) Zymomonas mobilis; (Pae) Pseudomonas aeruginosa; (Tma) Thermotoga maritima. Refer to the legend of Figure 1 for other organisms and to Supplemental Table S1 for more information about these organisms.


