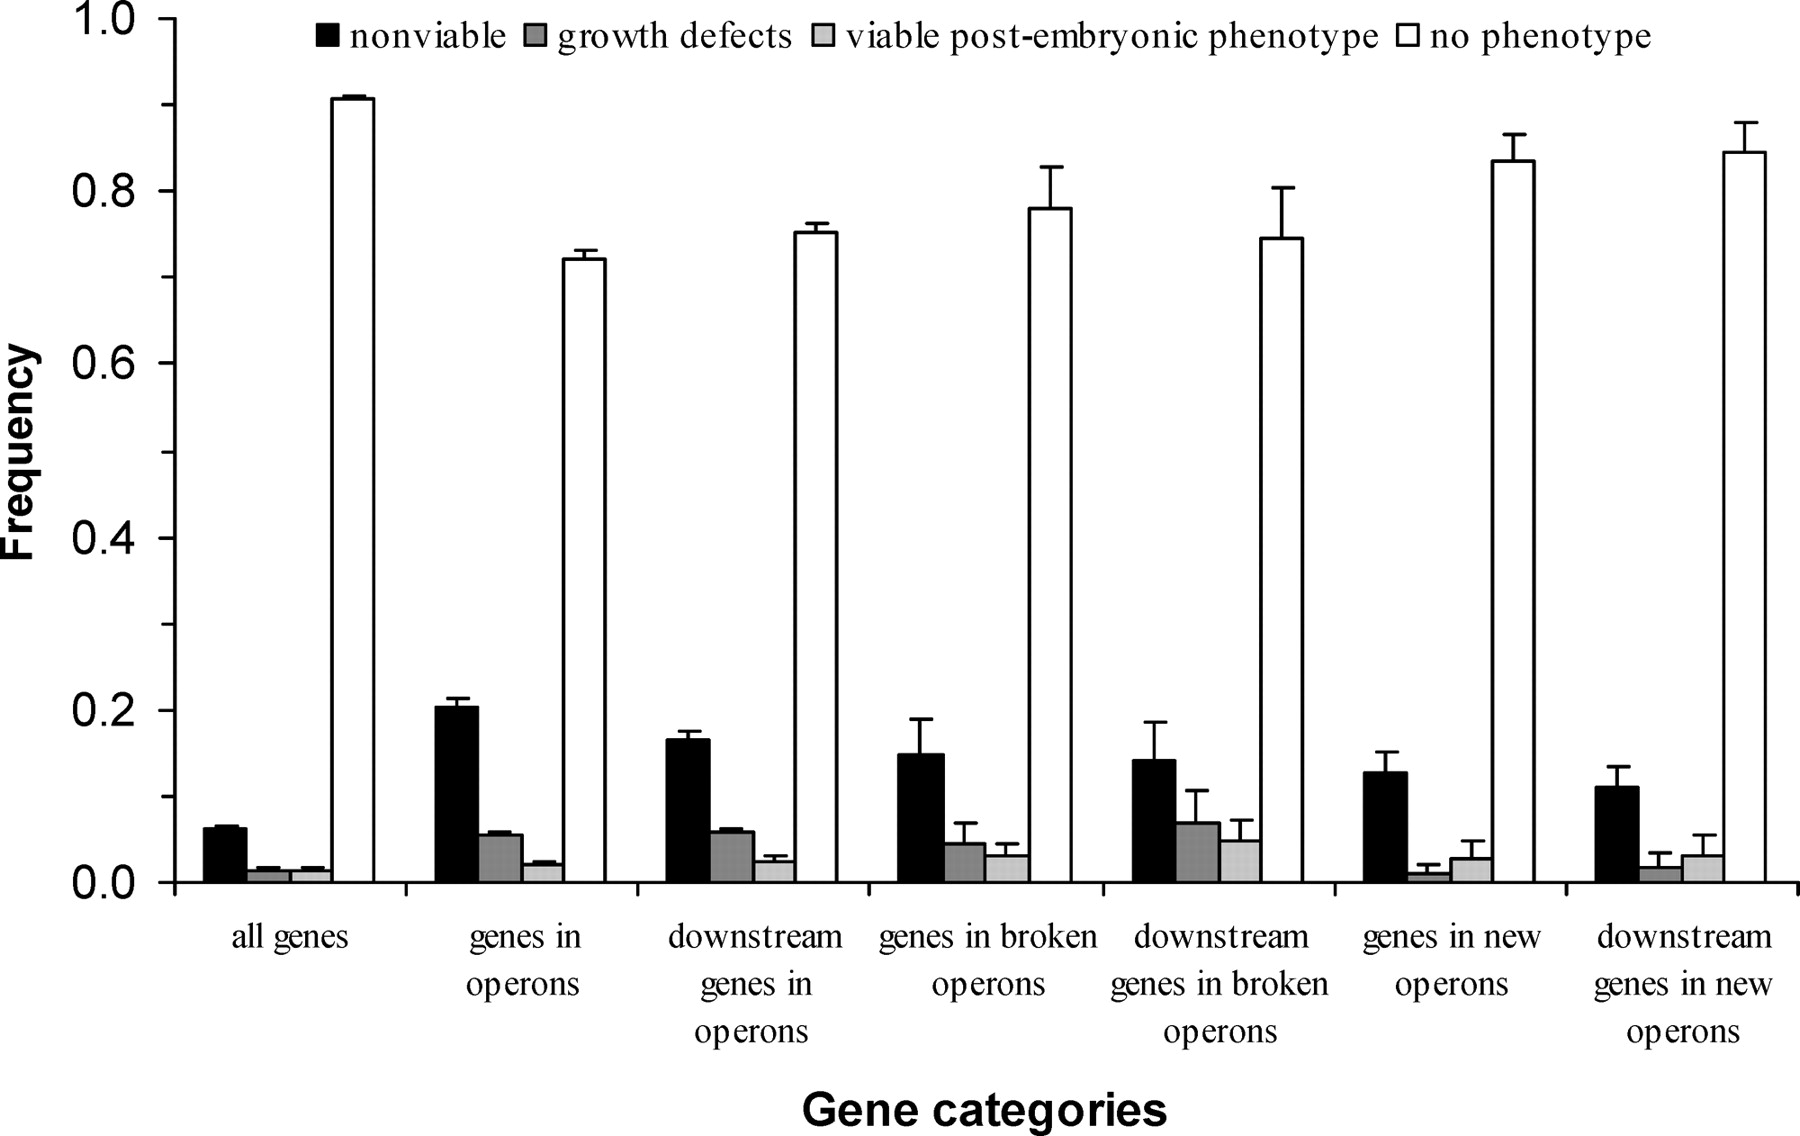
Evolutionary dynamics of nematode operons: Easy come, slow go

(Downloading may take up to 30 seconds. If the slide opens in your browser, select File -> Save As to save it.)

Click on image to view larger version.

Figure 3.
Figure 3.

Proportions of genes showing different RNAi phenotypes in different gene categories. The phenotypic data are from Kamath et al. (2003). Error bars show one standard error.

This Article

  1. Genome Res. 18: 412-421

Preprint Server