
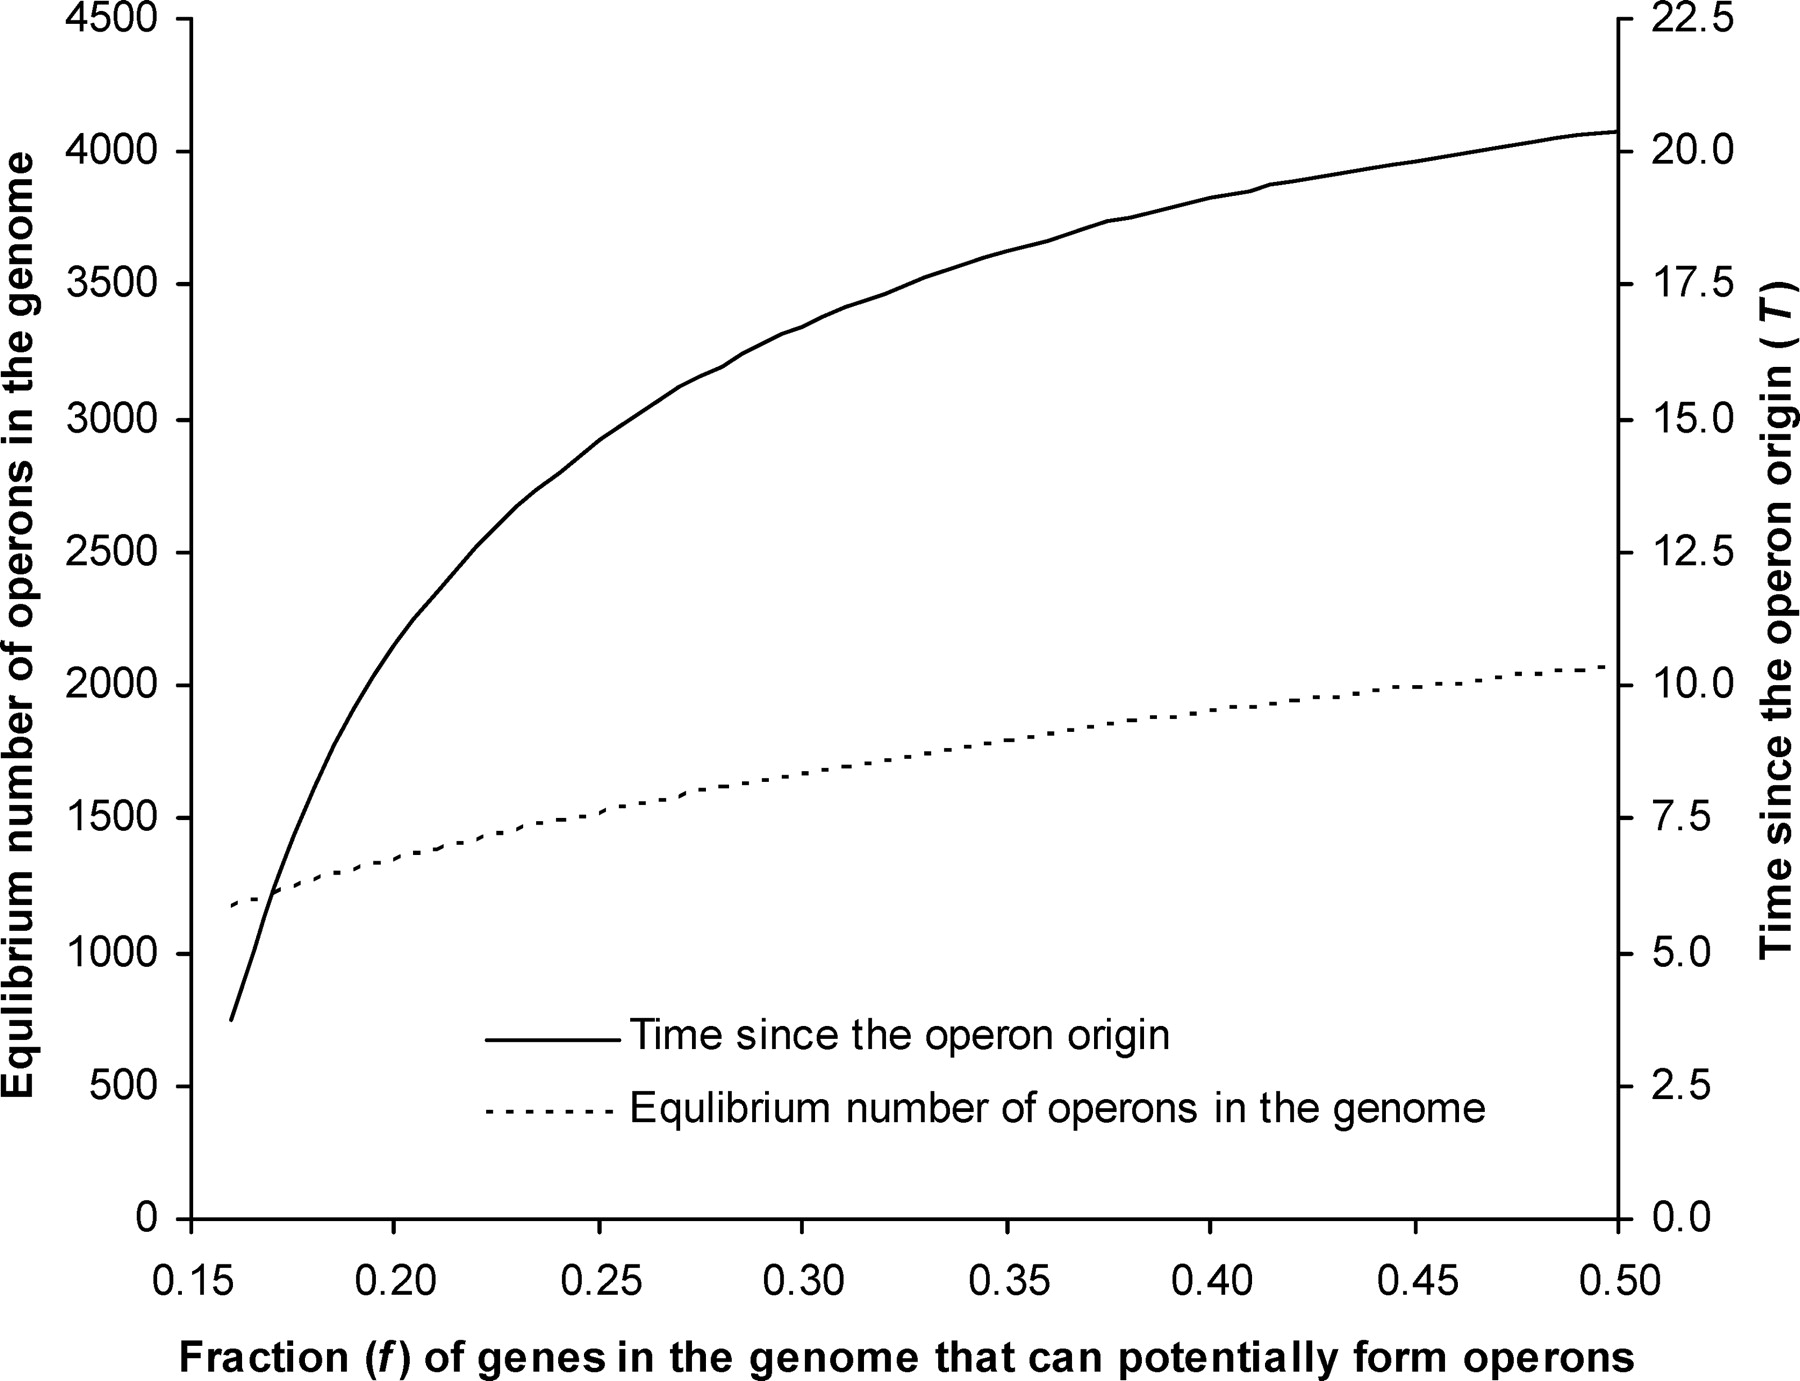
Figure 2.
Relationship between the proportion (f) of genes that can potentially be included in operons and the projected number of operons in the genome at equilibrium (left Y-axis) and that between f and the predicted evolutionary time since the origin of operons (right Y-axis), in unit of T, the divergence time between C. elegans and C. briggsae.


