
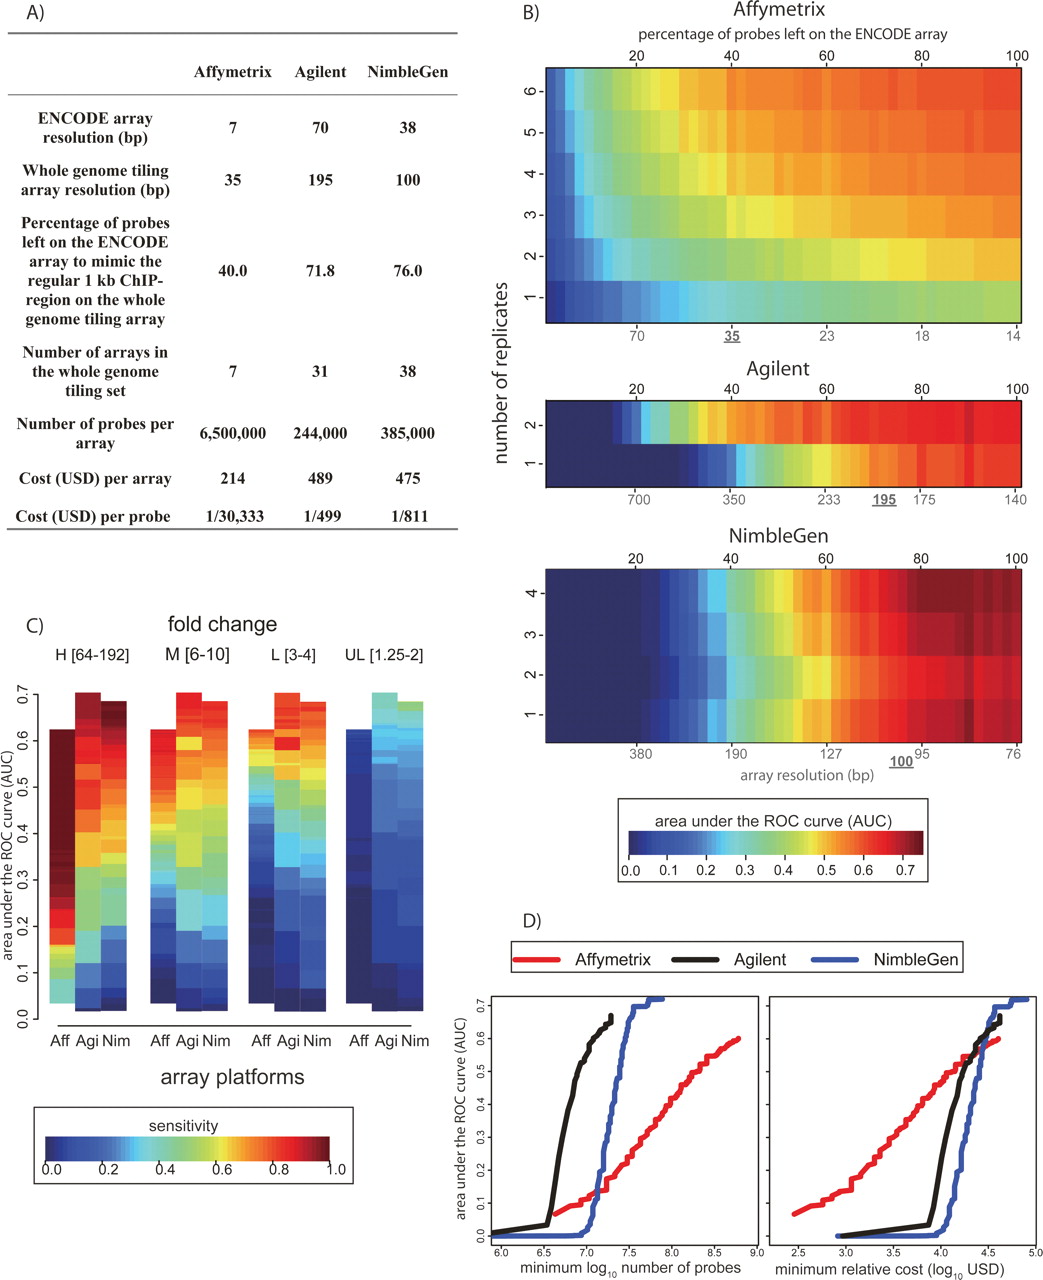
Cost versus detection power: simulation of whole-genome experiments. (A) Summary statistics for the simulation of commercial whole-genome tiling array experiments. (B) Array performance as a function of replicate number and tiling resolution (see Methods). AUC values are indicated by color (key at bottom). Black numbers on the top indicate the percentage of probes remaining on the ENCODE array in the simulation. The red coordinates at the bottom indicate the corresponding array resolution, assuming a 1-kb region of ChIP enrichment. The currently available (August 2007) commercial whole-genome tiling array resolution is underlined. (C) Array sensitivity according to enrichment level. As in Figure 3, the spike-in clones were divided into four levels of enrichment: High (64–192 fold); Medium (6–10 fold); Low (3–4 fold); and Ultra Low (1.25–2 fold). Sensitivity at each enrichment level is defined as the percentage of correctly predicted clones, with the total number of false positives equal to 5% of the total number of spike-in clones (color key at bottom). The array platforms are indicated along the X-axis. (D). Using our deletion analysis and current (August 2007) list prices for each commercial array technology, we calculated the number of probes and dollar amount required to produce a given AUC value (left panel). The minimum number of probes required to achieve a given AUC was determined by using the information in panel B for each platform, assuming a 1.5-Gb nonrepetitive genome. For Affymetrix, a single-channel platform, the need to perform separate ChIP and control/input hybridizations was accounted for in calculating probe number. In the righthand panel, the minimum cost required to achieve a given AUC value is plotted.


