
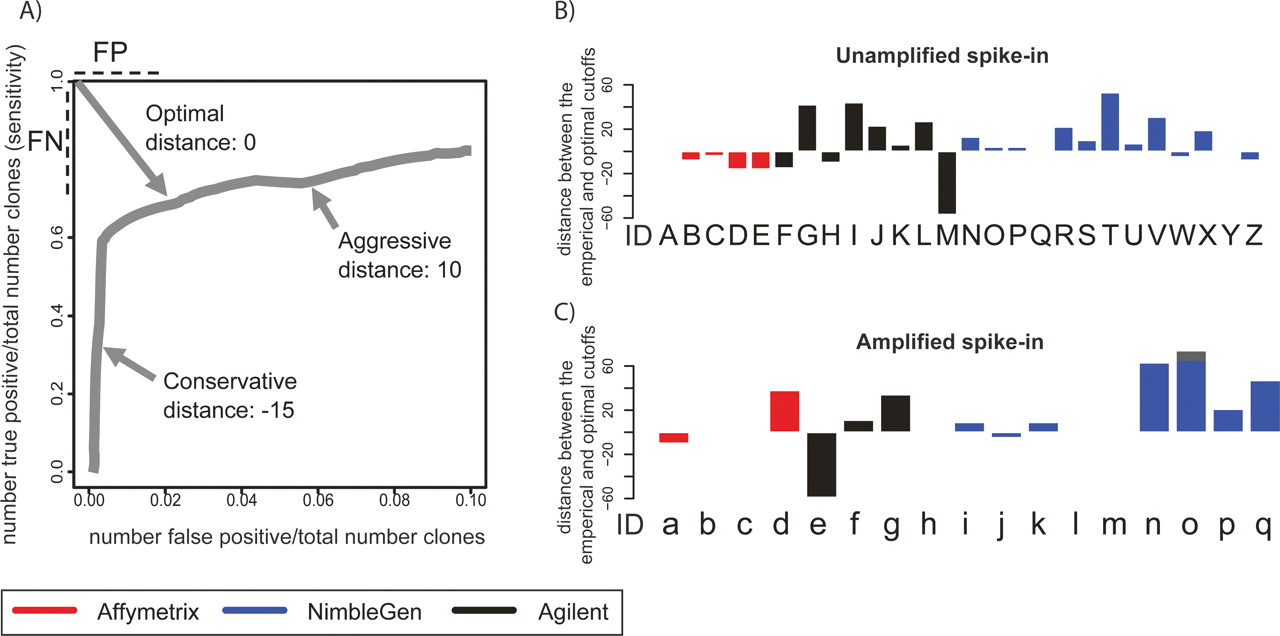
Evaluation of cutoff selection used for spike-in prediction. (A) We define the optimal threshold as the point on the ROC-like curve that is closest to the upper left corner, so long as the value on the X-axis ≤0.10. The distance in rank between empirical threshold (submitted by each group) and the optimal threshold along the ROC-like curve (hereafter E–O distance) is a rational evaluation of the accuracy of threshold selection. Aggressive and conservative thresholds will have positive and negative E–O distances, respectively. (B) The E–O distance for each set of experiments and predictions performed on the Unamplified samples. Letters under each bar refer to the experiment description in Figure 2A. (C) The same as B for the Amplified samples. Letters under each bar refer to the experiment description in Figure 2B.


