
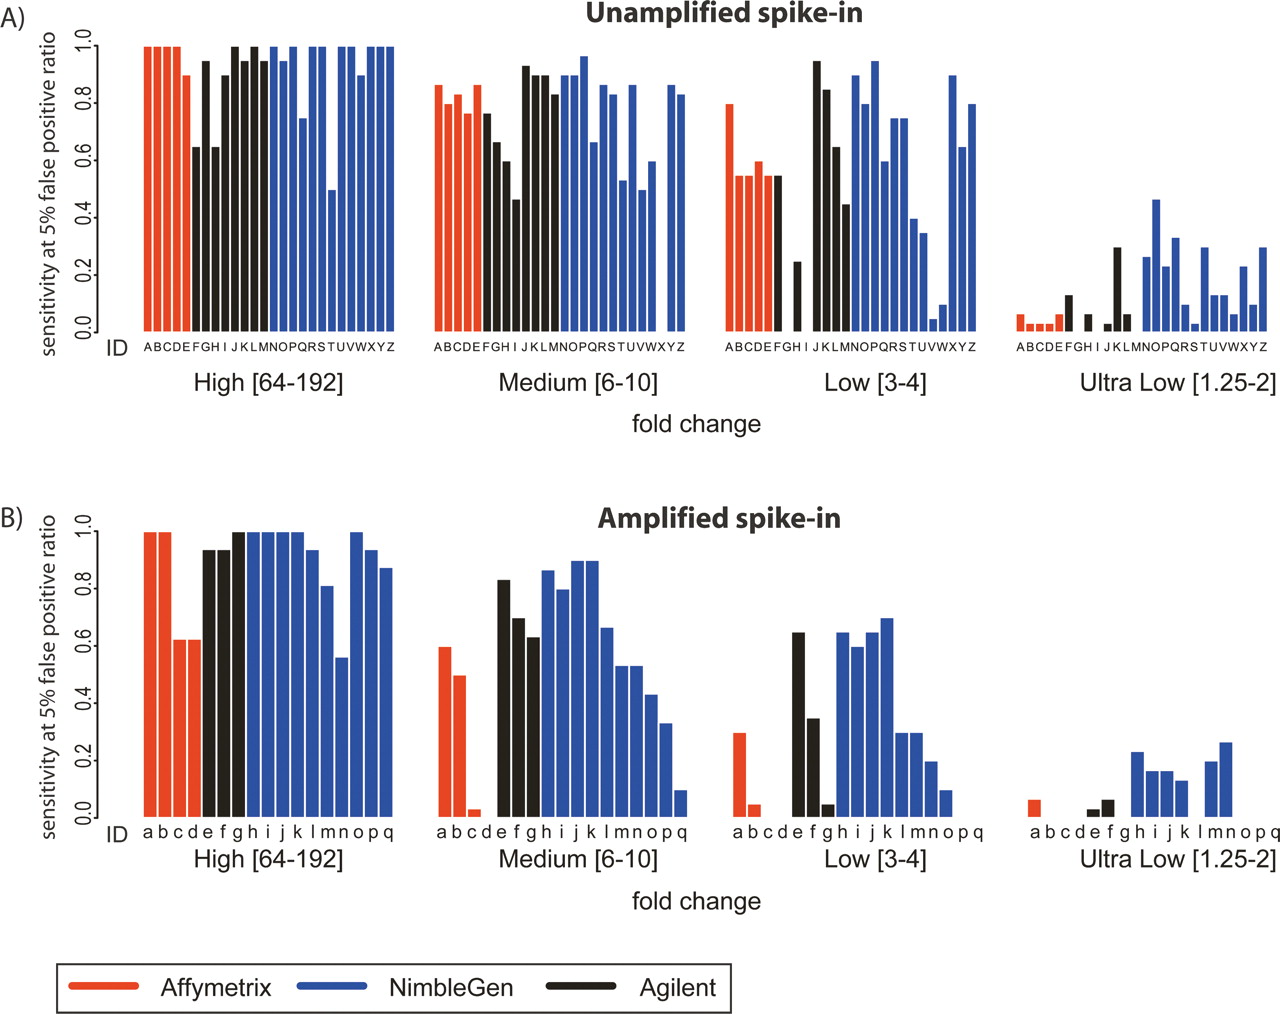
Enrichment-specific sensitivity. (A) Enrichment-specific sensitivity for Unamplified spike-in mixtures. The spike-in clones were divided into four levels of enrichment: High fold-change (64–192); Medium fold-change (6–10); Low fold-change (3–4); and Ultra Low fold-change (1.25–2). Enrichment-specific array prediction sensitivity (Y-axis) is defined as the percentage of correctly predicted enrichment-specific clones, with the total number of false positives equal to 5% of the total number of spike-in clones. Letters under each bar refer to the experiment description in Figure 2A. (B) The same as A, but for Amplified samples. Letters under each bar refer to the experiment description in Figure 2B.


