
Table 1.
Overall number of bound regions and overlaps between data sets
Click on table to view larger version.
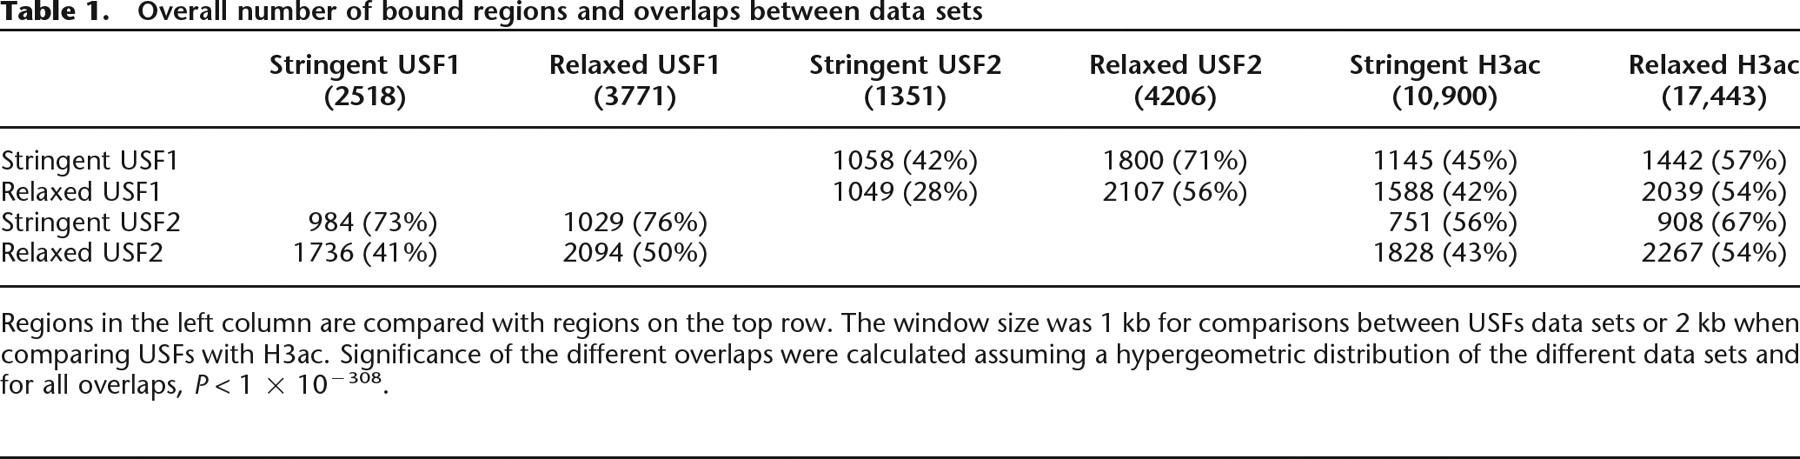
Regions in the left column are compared with regions on the top row. The window size was 1 kb for comparisons between USFs data sets or 2 kb when comparing USFs with H3ac. Significance of the different overlaps were calculated assuming a hypergeometric distribution of the different data sets and for all overlaps, P < 1 × 10−308.


