
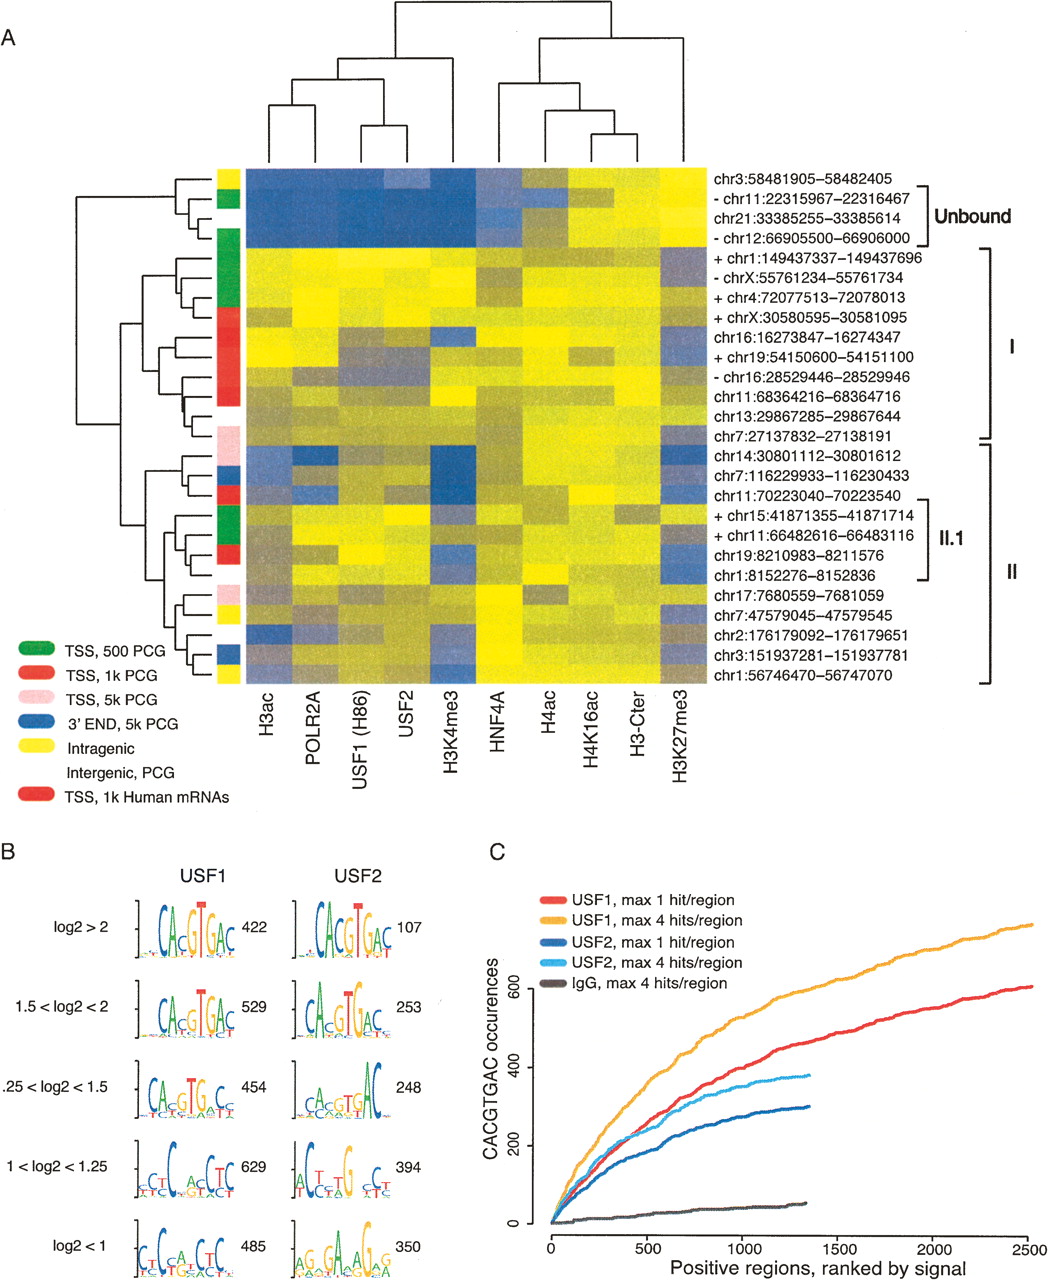
USFs binding determinants. (A) Twenty-six selected regions were clustered based on qPCR signals for the indicated transcription factors and histone modifications. The column colors indicate the qPCR signal from high (yellow) to low (blue) values. The genomic coordinates of the analyzed regions are presented to the right, while the genomic location of each region is indicated by the color to the left. Plus (+) and minus (−) signs next to the genomic coordinates for regions proximal to PCG TSS indicate CpG+ or CpG− regions, respectively. The genomic positions are based on Human Mar. 2006 (hg18) assembly (NCBI Build 36.1). (B) The top enriched motifs identified ab initio for USF1 and USF2 in groups based on their log2 enrichments values. The number of regions in each group is presented. (C) Candidate scanning approaches were used to search for the E-box (i.e., CACGTGAC) among USF1- or USF2-bound regions, ranked in descending order according to their log2 enrichment values. For both USF1 and USF2, we considered either the total number of E-box occurrences with a maximum of four per region or just one occurrence per region. To see how many occurrences are expected in a background data set, we also generated a similar slope from IgG-positive regions.


