
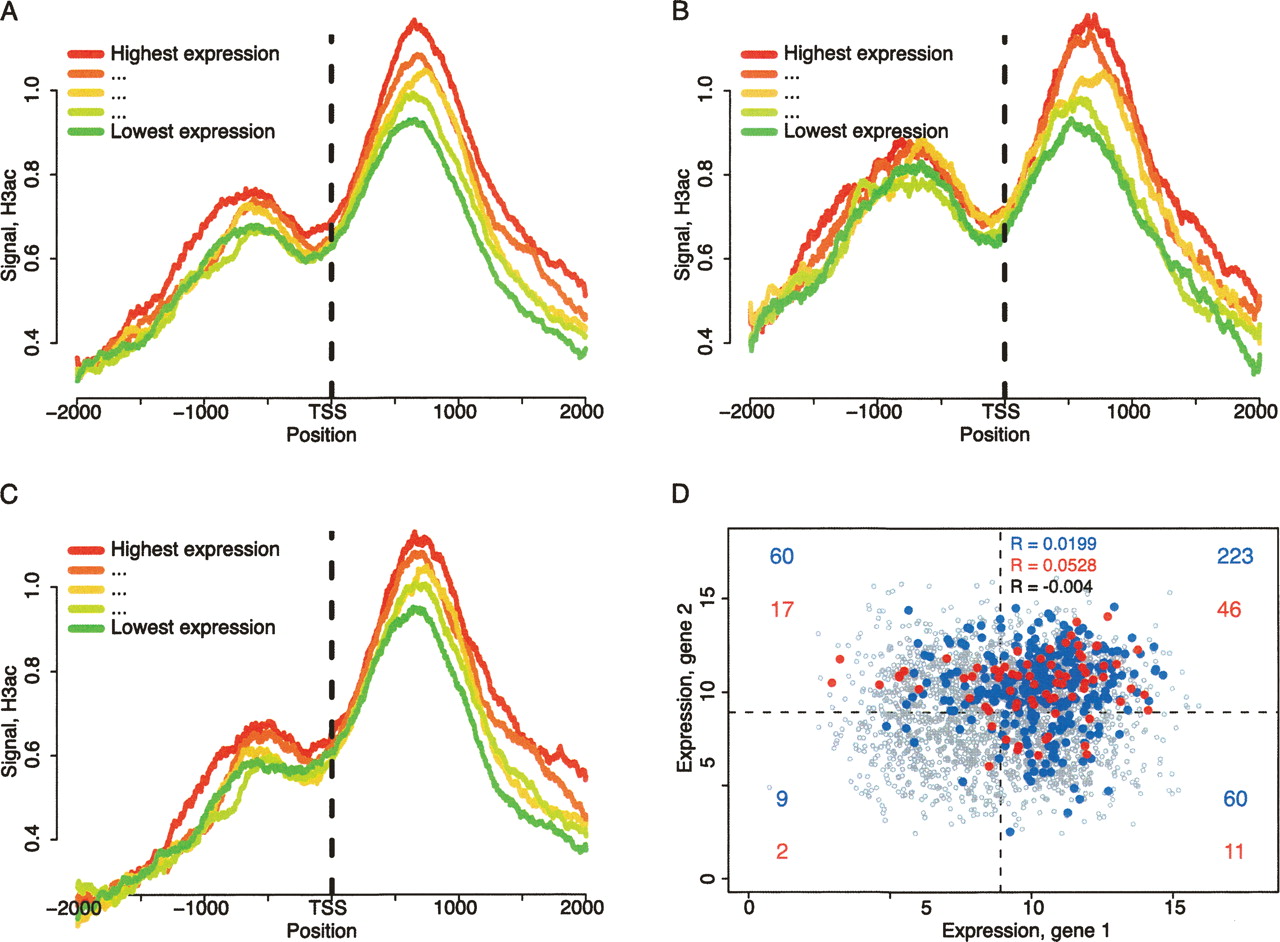
Positive correlation between H3ac downstream of PCG TSS and expression levels. (A) H3ac profiles of PCGs divided in five equal numbered groups based on their expression levels. All PCGs bound by H3ac within 1 kb of their TSS and where expression data were available were considered. Similar H3ac profiles when separating the PCGs above in bidirectional (PCG+PCG or human mRNA) (B) or unidirectional (C). (D) PCGs bound by H3ac (blue) or USF1 (red) within 1 kb of their TSS, found in non-overlapping bidirectional conformation and with available expression data for the two PCGs involved in each bidirectional pair were considered; 1500 pairs of PCG were randomly sampled, and their expression levels were similarly represented (gray). The dotted lines indicate the average level of expression for the randomly sampled PCGs. Pearson correlation (R) values for USF1, H3ac, and randomly sampled data sets expression levels are in the upper right corner. The expression data was log2 transformed.


