
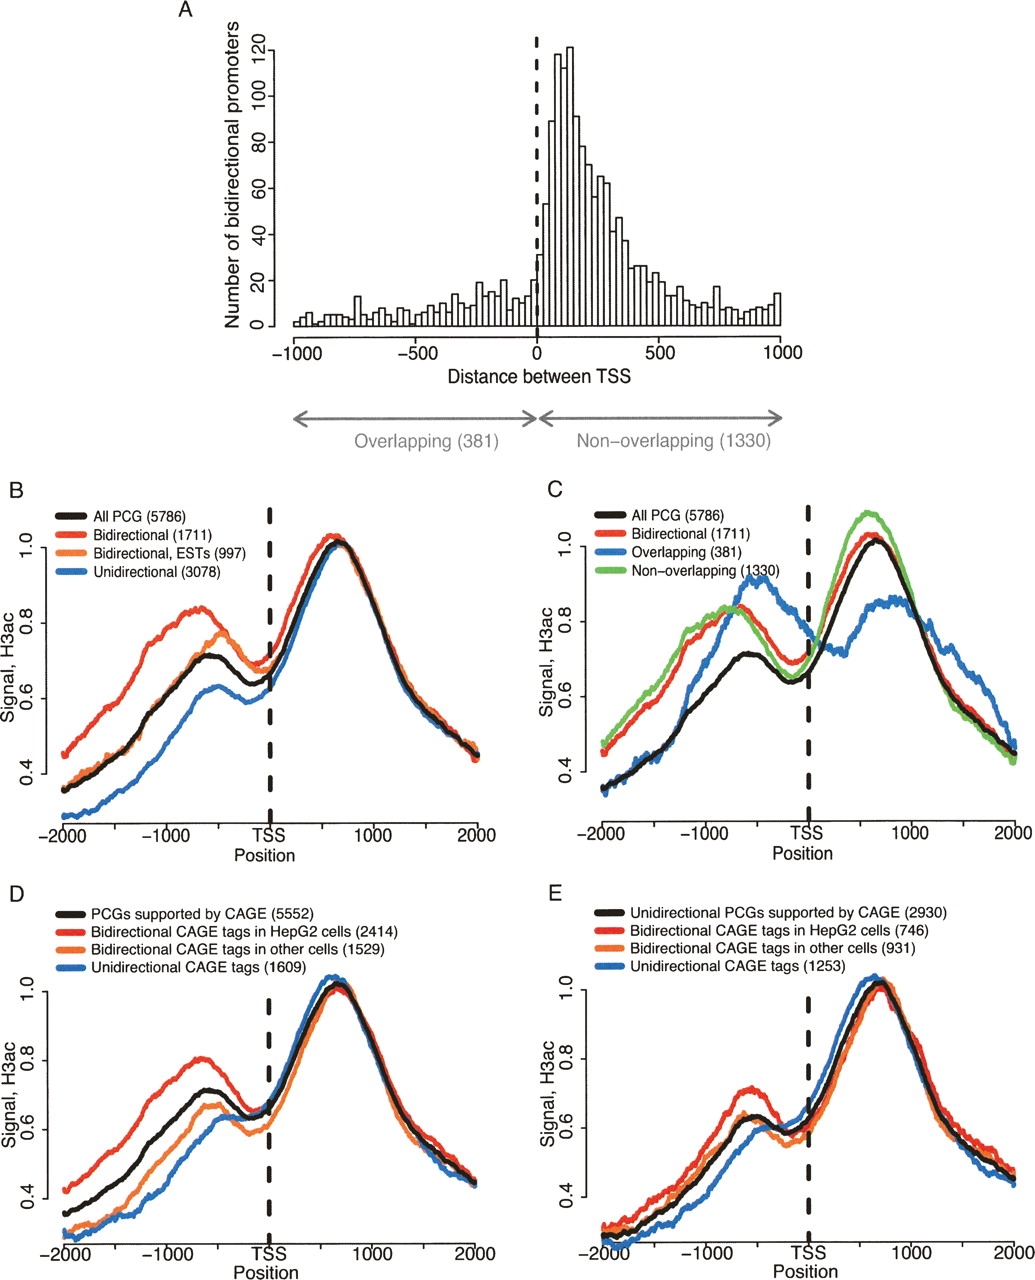
H3ac profiles around TSS are influenced by bidirectional conformation. (A) Histogram showing the distances between the two TSSs in each bidirectional pair. PCGs bound by H3ac within 1 kb of their TSS and with at least one anti-sense PCG or human mRNA TSS within 1 kb of their TSS were considered. Negative distances correspond to overlapping TSSs. (B) H3ac signals around PCGs separated into bidirectional (at least one anti-sense PCG or human mRNA TSS within 1 kb of their TSS), bidirectional-ESTs (at least one anti-sense spliced EST TSS within 1 kb of their TSS) or unidirectional (no anti-sense PCG, human mRNA, or spliced EST TSS within 1 kb of their TSS). (C) H3ac binding signals for all PCGs (black line), all PCGs with bidirectional conformation (red), overlapping bidirectional conformation (blue), and non-overlapping bidirectional conformation (green). (D,E) H3ac signal profiles were generated for different groups of PCGs (D) and unidirectional PCGs (E), as indicated by color codes and that were created based on CAGE-tag data.


