
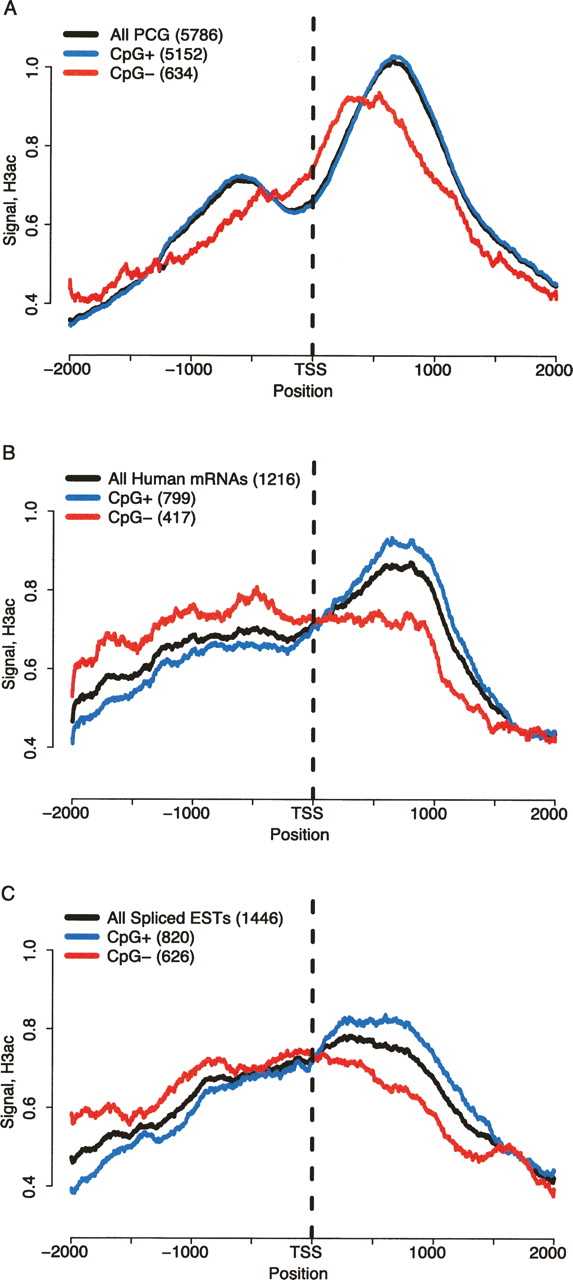
Figure 2.
H3ac profile around TSSs. H3ac profiles around TSS of PCGs (A), human mRNAs (B), and spliced ESTs (C) depending on the presence/absence of CpG islands. All genes are bound by H3ac within 1 kb of their TSSs. H3ac binding profiles were created for each group by plotting the H3ac ChIP-chip binding signals (in log2 scale, Y-axes) around the TSS of each transcript, using a window of ±2 kb (X-axes, positive numbers are downstream of TSS; negative numbers are upstream of TSS).


