
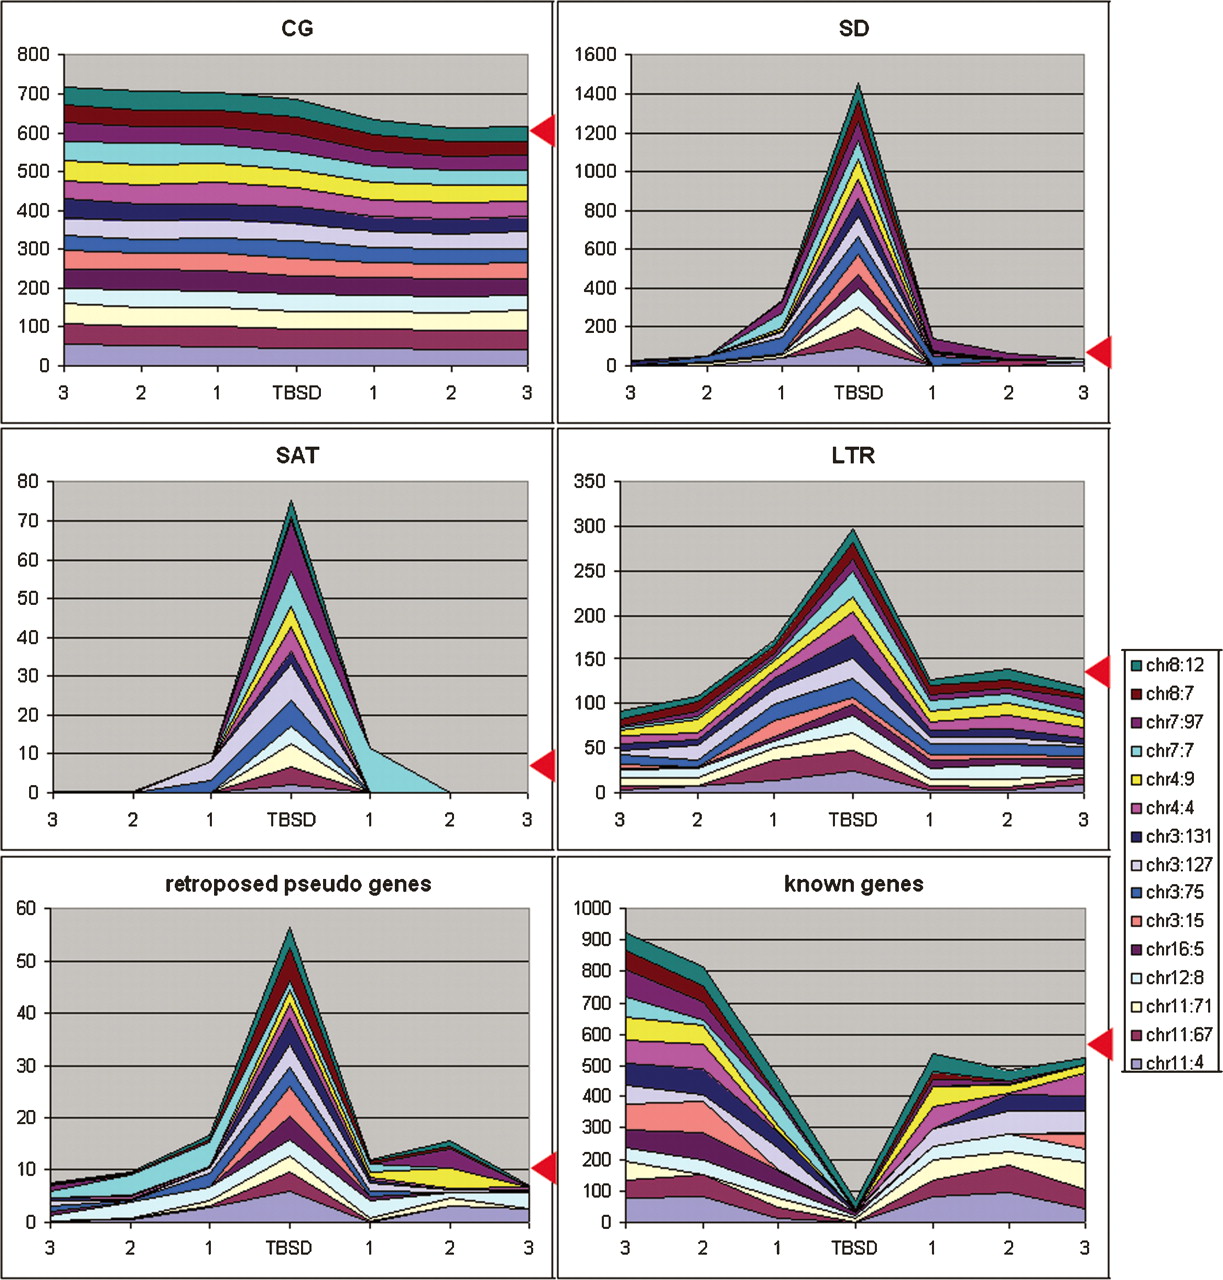
Figure 6.
Sequence features in the region surrounding TBSD. Cumulative area shows contents (in percentages) of particular sequence features, which were identified in different TBSD sites and in three successive sequence windows of the same size departing from the TBSD sites (points 1, 2, and 3, respectively). Red arrowheads show cumulative value for the same number of random regions, calculated based on average values for the human genome. Regions are pter–qter oriented, as described in the Results section, “TBSDs are located at the transitions between CG- rich and poor areas.”


