
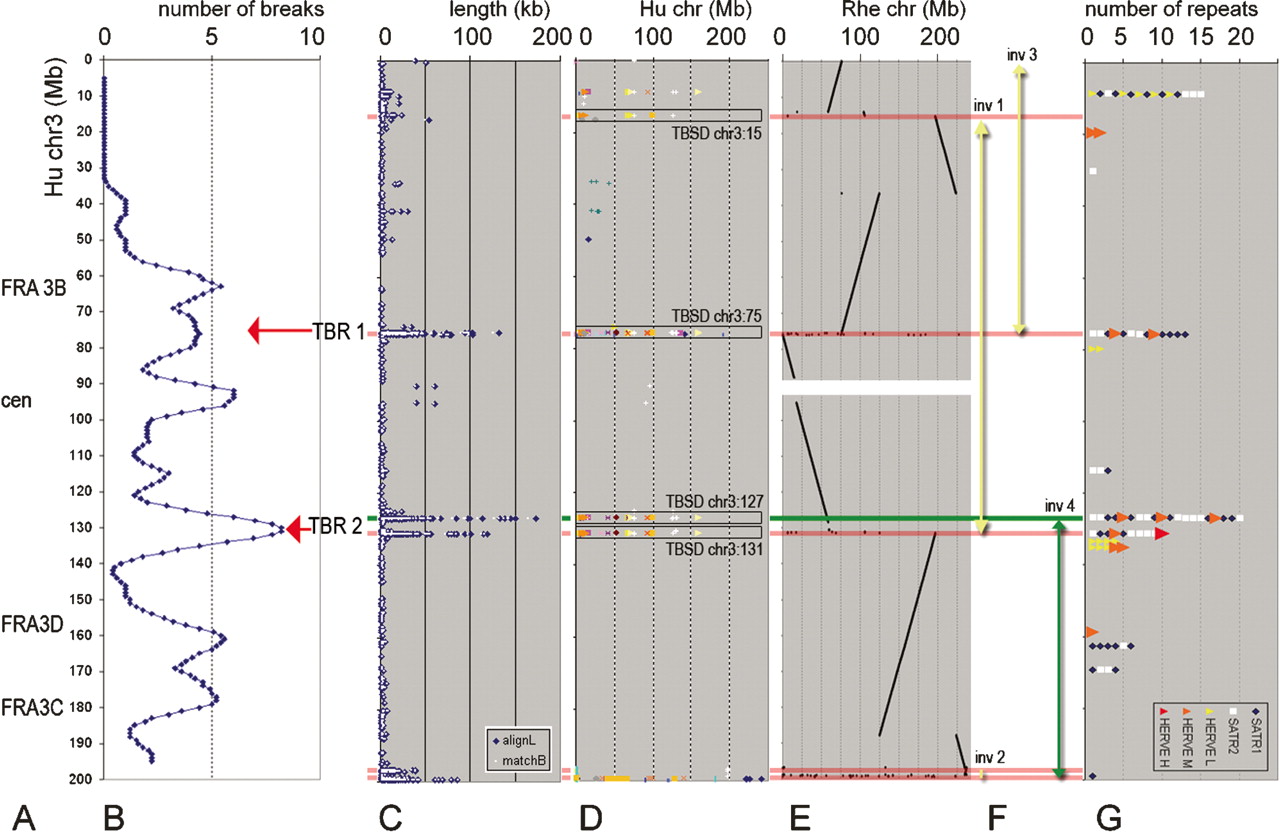
Distribution of chr 3 features from 3-pter (top, 0 Mb) to 3-qter (bottom, 200 Mb). Megabase position is shown on vertical scale. (A) Approximate positions of known instability regions, including fragile sites FRA3B, FRA3C, and FRA3D (Schwartz et al. 2006) and pericentromeric region (cen). (B) Cumulative profile for 54 break regions detected by mpFISH in 10 carcinoma cell lines (for explanations, see Supplemental Fig. 6). Red arrows show newly identified tumor break-prone regions (TBRs). (C) SDs of different lengths. Blue rhomb (“alignL”), length of aligned duplicated sequence; white spot (“matchB”), number of match-pairs in aligned unit. (D) Dot-plot alignment of the duplicated (>90% homology) sequences longer than 10 kb, to different human chromosomes (shown with different colors) in relation to their megabase position on a chromosome (horizontal axis). (E) Dot-plot alignment of the rhesus orthologous sequences in relation to their megabase position on chromosome (horizontal axis). The human–rhesus synteny breaks, which correspond to human branch evolution, are shown by red horizontal lines. The human–mouse synteny break, which corresponds to a chromosome rearrangement during early primate evolution, is shown by a green horizontal line. (F) Four inversions in human chr 3 evolution: three occurred after divergence from rhesus branch (yellow arrows), the fourth after divergence from mouse (green arrow). (G) SATR1 and SATR2 satellite repeats, flanking the moderate score HERVE element (HERVE M) are associated with the TBRs, long SDs, and evolutionary chr 3 breaks. HERVE L and HERVE H: low and high score HERVE elements, respectively. Horizontal axis: number of the repeat elements within a particular site.


