
Table 1.
A selection of annotated genomic islands that show structural variation
Click on table to view larger version.
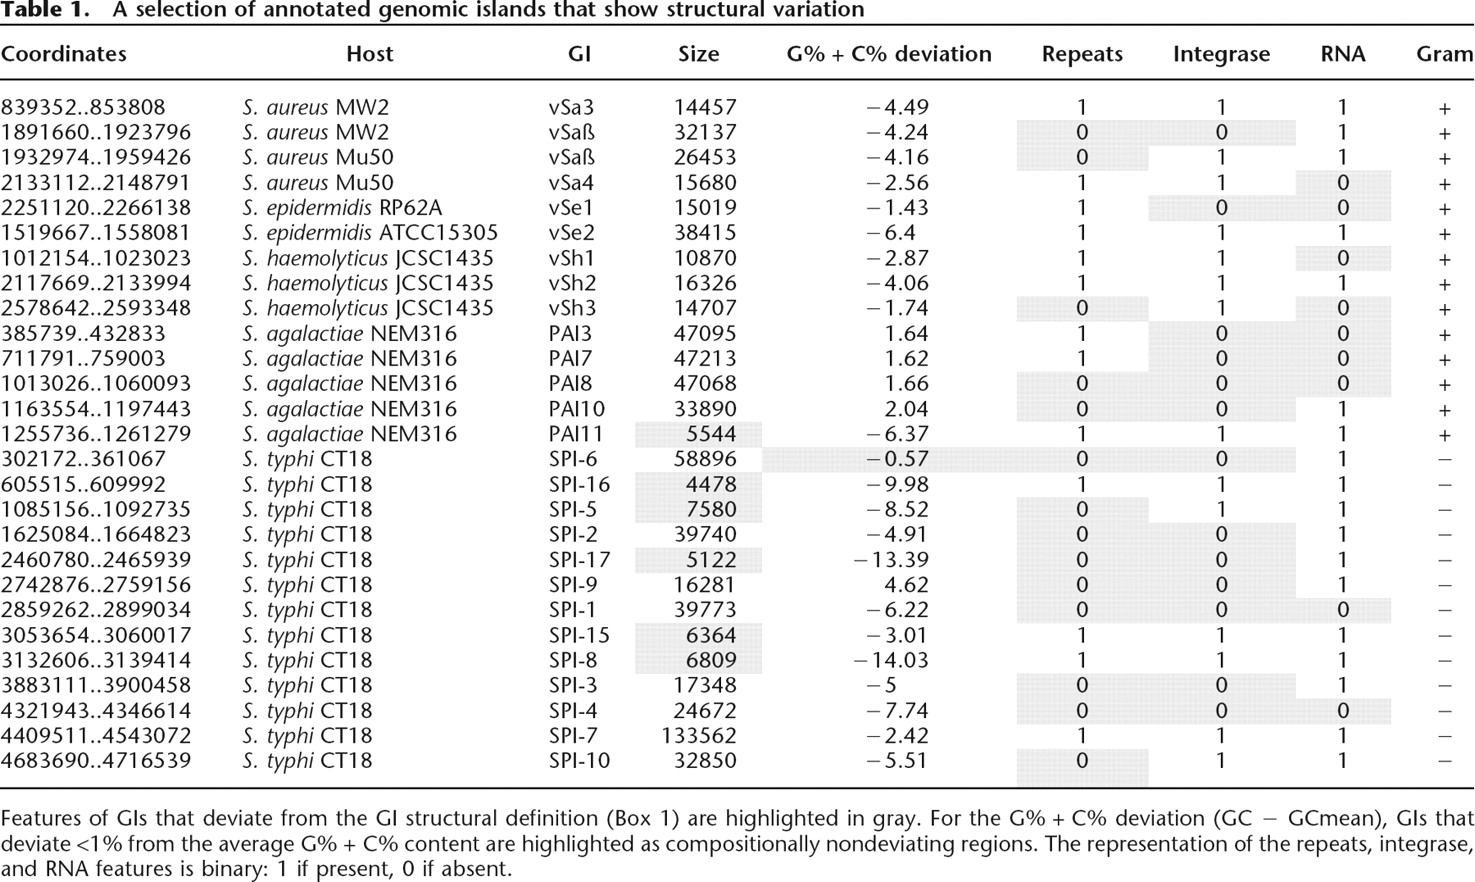
Features of GIs that deviate from the GI structural definition (Box 1) are highlighted in gray. For the G% + C% deviation (GC − GCmean), GIs that deviate <1% from the average G% + C% content are highlighted as compositionally nondeviating regions. The representation of the repeats, integrase, and RNA features is binary: 1 if present, 0 if absent.


