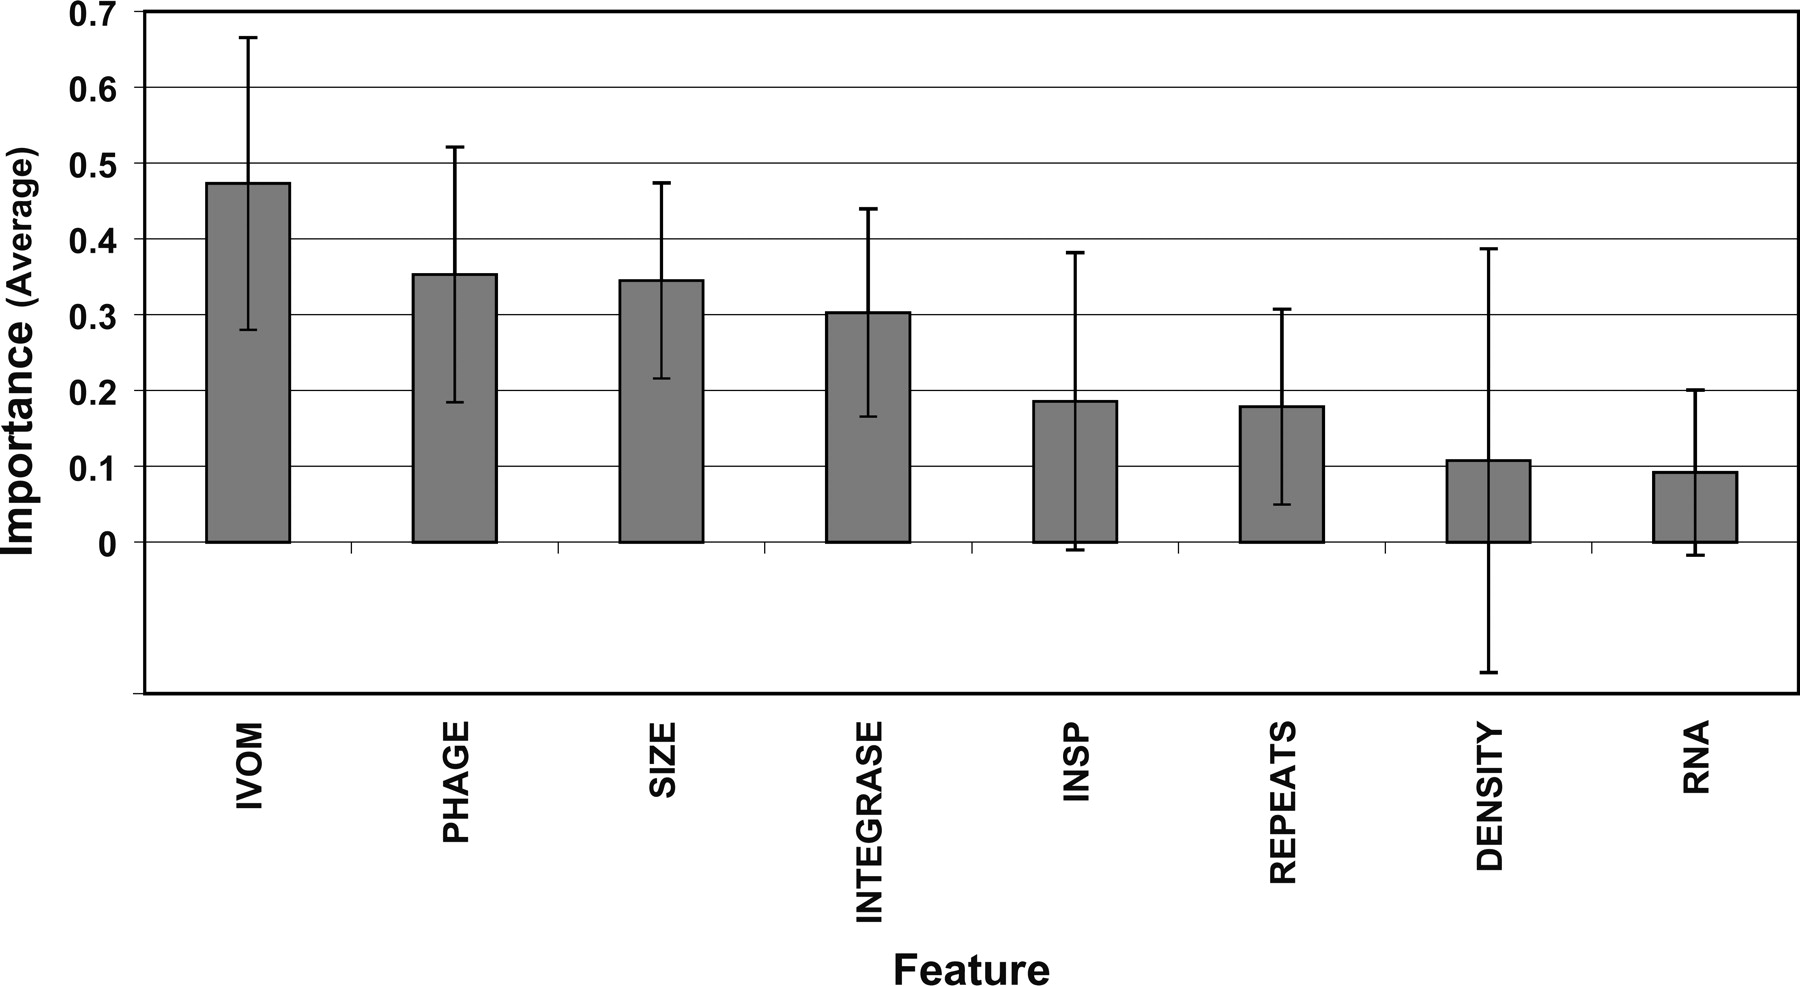
Resolving the structural features of genomic islands: A machine learning approach

(Downloading may take up to 30 seconds. If the slide opens in your browser, select File -> Save As to save it.)

Click on image to view larger version.

Figure 4.
Figure 4.

Bar chart illustrating the average “importance,” across 11 structural GI models, of the eight structural features evaluated in this analysis. The eight features have been sorted (in decreasing order) based on their average importance. Error bars show ±1 SD.

This Article

  1. Genome Res. 18: 331-342

Preprint Server