
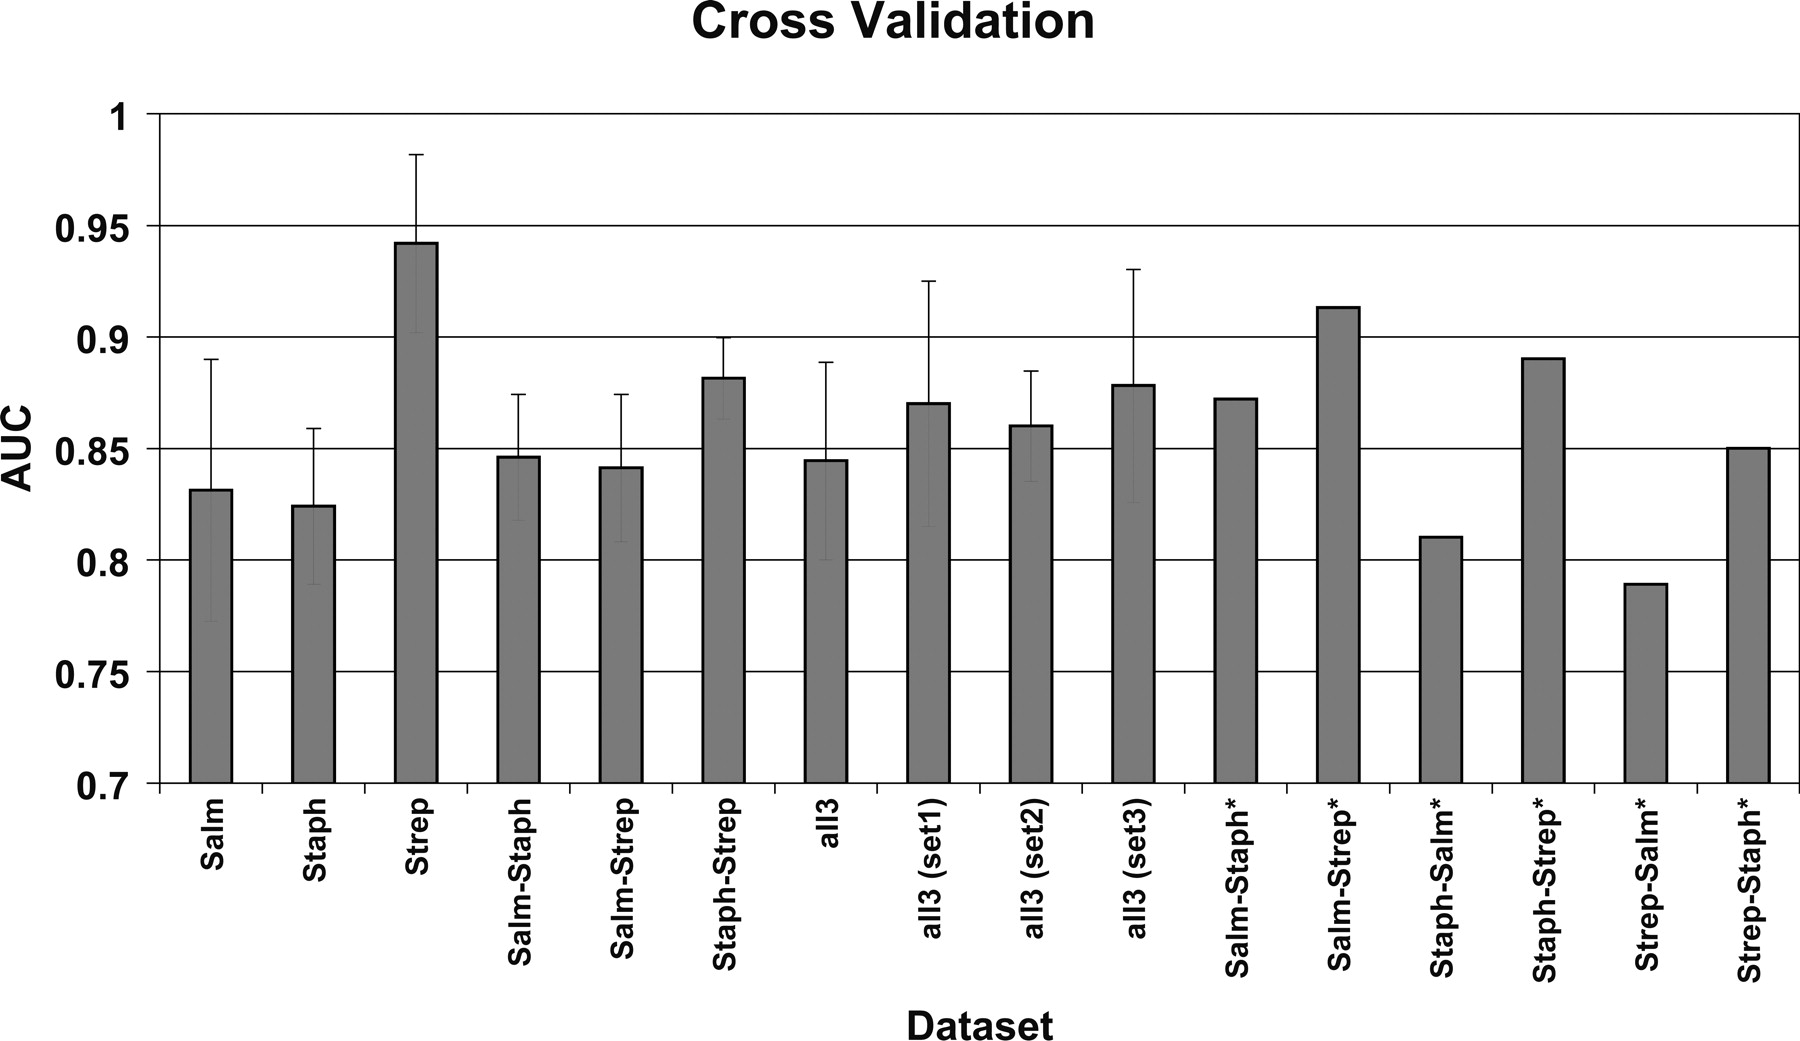
A bar chart illustrating the average performance of the RVM classifier, under different training and test data sets. Each data set is split into five subsets of approximately equal size; four of the five subsets are used to train an RVM model, while the omitted subset is used to test the performance of this model. This process is repeated five times on non-overlapping test sets (fivefold cross-validation). The performance of the RVM models was evaluated through the receiver operating characteristic (ROC) curve. The area under the ROC curve (AUC) is a measure of the model’s accuracy: The closer the curve follows the left-hand and the top border of the ROC space, the more accurate the classification model. A perfect classifier would give an AUC of 1, while a classifier that makes a random guess would give an AUC of 0.5. The average value and ±1 SD of the AUC over the five subsets of the fivefold cross-validation is calculated for the first 10 data sets. The AUC values for the last six data sets (with the asterisk) summarize the performance of the RVM, when trained on the whole data set of the first genus and tested on the whole data set of the second genus, for example, for the Salm-Strep* data set, the 421 Salmonella-specific regions were used to train a GI model that was tested on the 107 Streptococcus-specific regions.


