
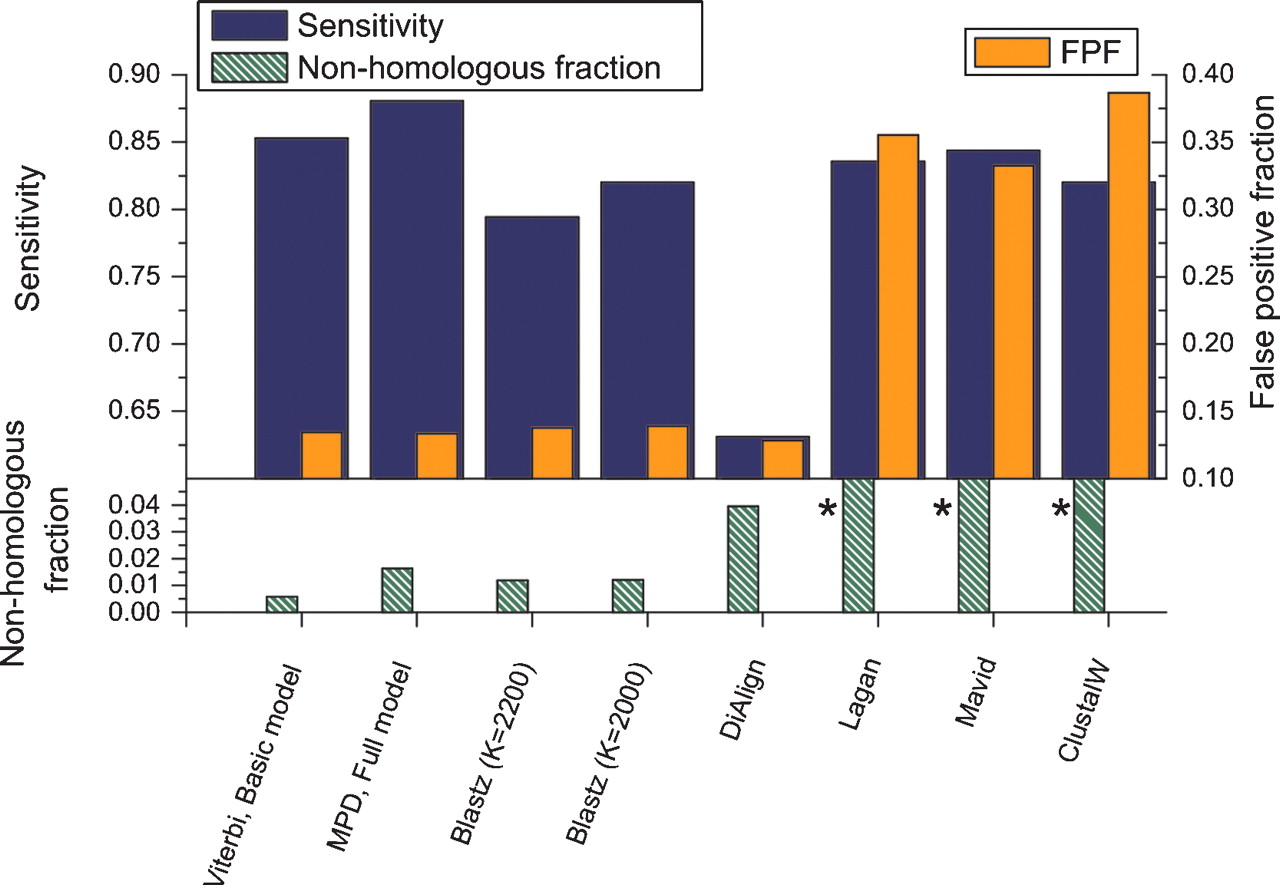
Figure 9.
Performance comparison of score-based aligners. Histogram bars show sensitivity (black; top left axis), false-positive fraction (gray, right axis) and nonhomologous fraction (striped, bottom left axis), for simulated sequence based on human–mouse evolutionary parameters. The results for two probabilistic aligners (leftmost two sets) are included for comparison. Histogram bars marked by asterisks are off the scale; nonhomologous fraction for Lagan, 0.212; Mavid, 0.201; ClustalW, 0.223. Note that the axes in Figure 6 have different scales.


