
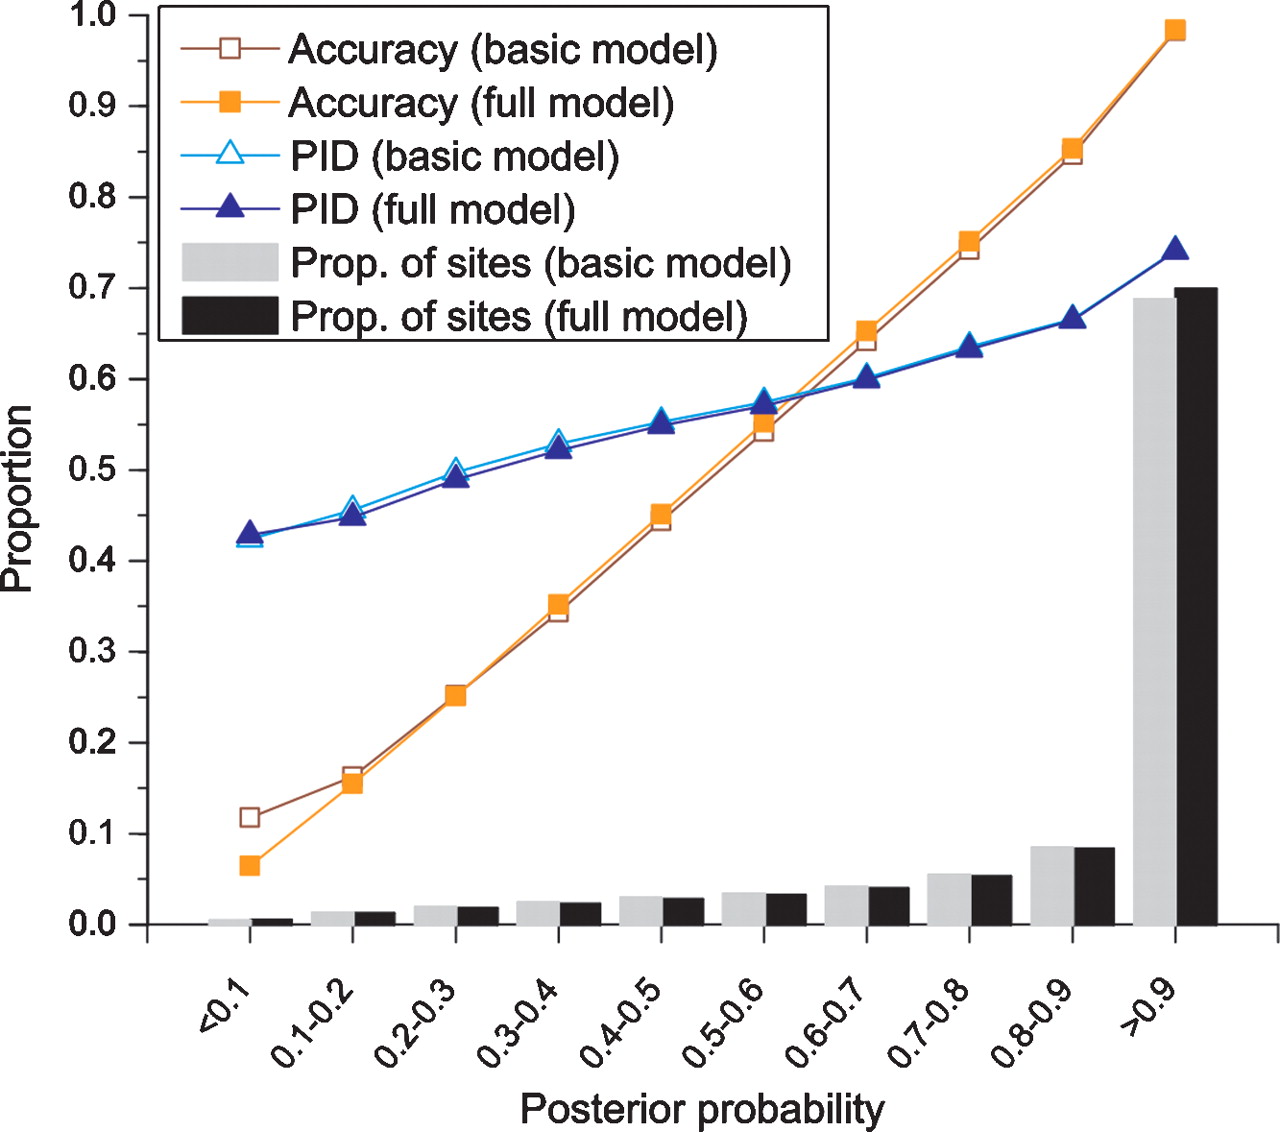
Figure 8.
Posterior probability is an excellent indicator of alignment accuracy. Shown are the proportion of correctly aligned nucleotides (squares), the average sequence identity (triangles), and the proportion of nucleotides (histogram bars) across 10 posterior probability quantiles, obtained from realigned simulated human–mouse sequence data. For realignment, we used Viterbi decoding on the basic and full models.


