
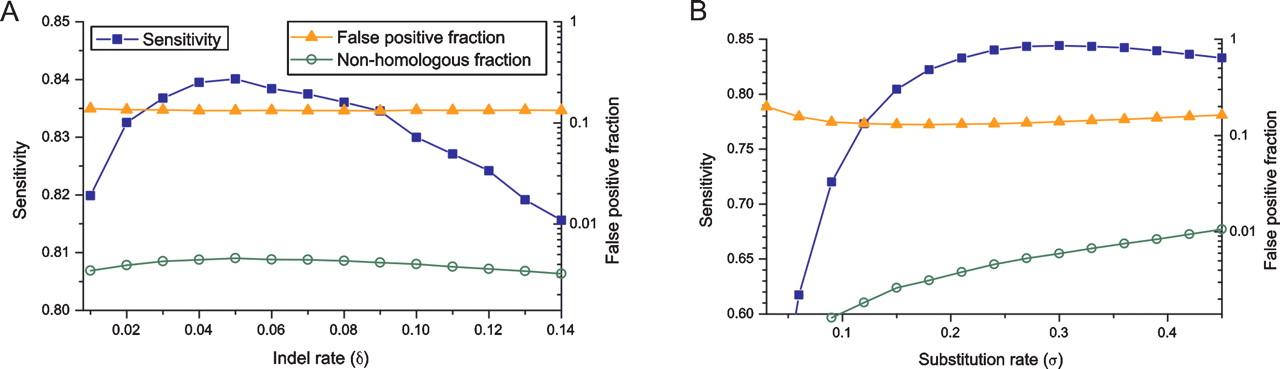
Figure 4.
Suboptimal parameters have minimal impact on alignment accuracy. Shown are: sensitivity to identify homologous nucleotide pairs (blue squares, on left axis), the false-positive fraction (orange triangles, on right axis), and the nonhomologous fraction (green circles, on right axis). Sequences were generated under a Jukes–Cantor model with substitution rate σ = 0.3 and indel rate δ = 0.05, and (A) realigned using a fixed substitution rate σ = 0.3 and a range of indel rates, and (B) using a fixed indel rate δ = 0.05 and variable σ.


