
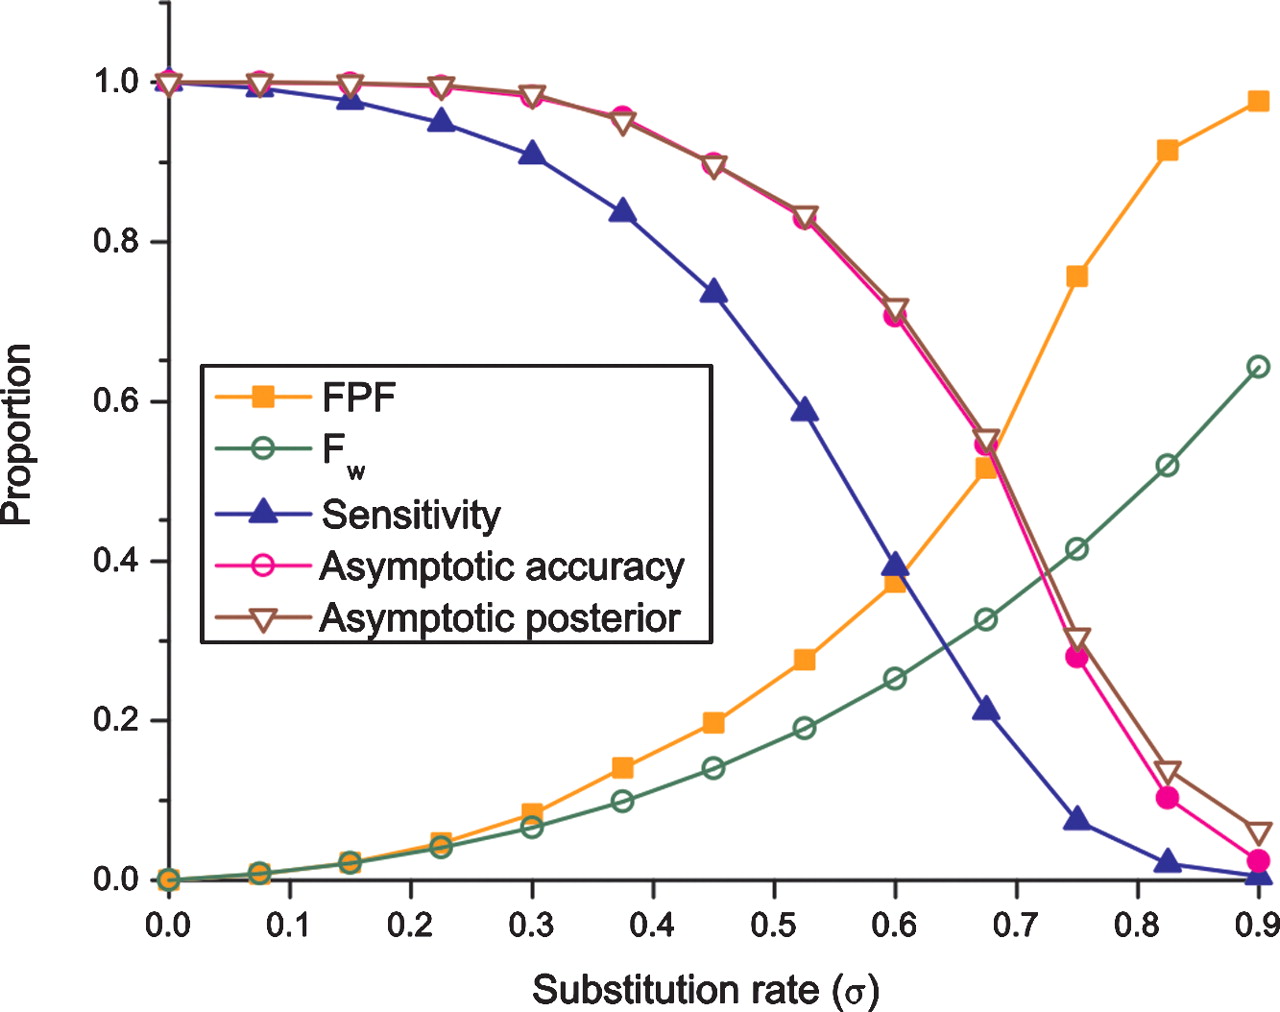
Dependence of alignment accuracy on evolutionary distance. Accuracy decreases with increasing evolutionary distance. Shown are the false-positive fraction (FPF, orange squares); the predicted FPF based on gap wander alone (Fw, green open circles); the sensitivity (blue solid triangles); the proportion of correct alignment columns at distance 15 from the nearest gap (asymptotic accuracy, pink dots); and the average posterior probability at the same distance (asymptotic posterior, brown open triangles). Sequences were simulated for various values of the divergence σ (horizontal axes), and realigned using the same σ value. The substitution/indel rate ratio was fixed at γ = σ/δ = 7.5. Qualitatively the same behavior is seen when realigning using a fixed σ (see Supplemental Fig. S2).


