
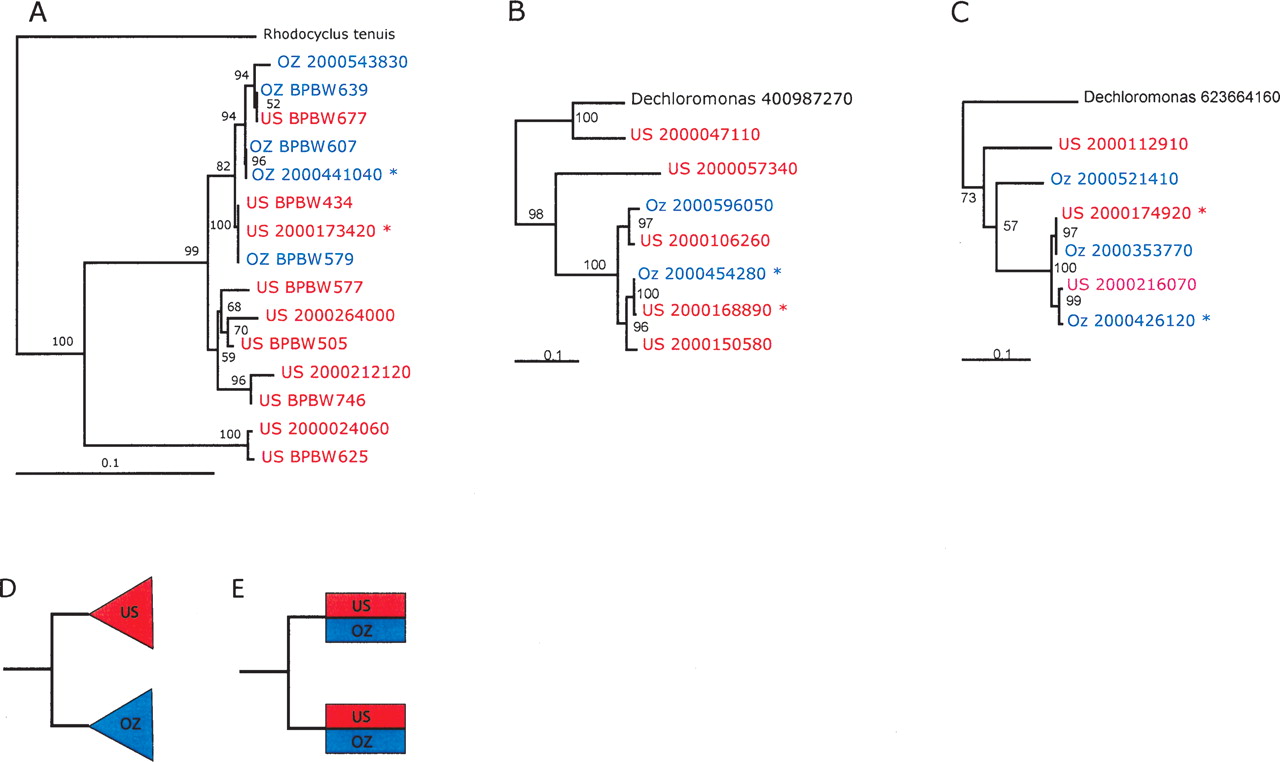
Gene phylogenies reconstructed using nucleotide sequence show geographic intermingling of CAP strains. Sequences obtained from the US and OZ samples are shown in red and blue, respectively. Asterisks mark dominant strains. IMG (Markowitz et al. 2006) gene object identifiers (beginning with 2000) are given for genes derived from metagenomic data. Support for interior nodes are indicated by bootstrap resampling percentages. The following trees are shown. (A) Polyphosphate kinase (PCR-amplified clones begin with BPBW); (B) Ribosomal protein L9; (C) holiday junction resolvase, DNA-binding subunit RuvA. Schematics are provided for reference to show the expected tree topologies for endemic (D) and freely migrating (E) populations. Note that in the latter case, high recombination frequencies between local and introduced strains may mask dispersal patterns.


