
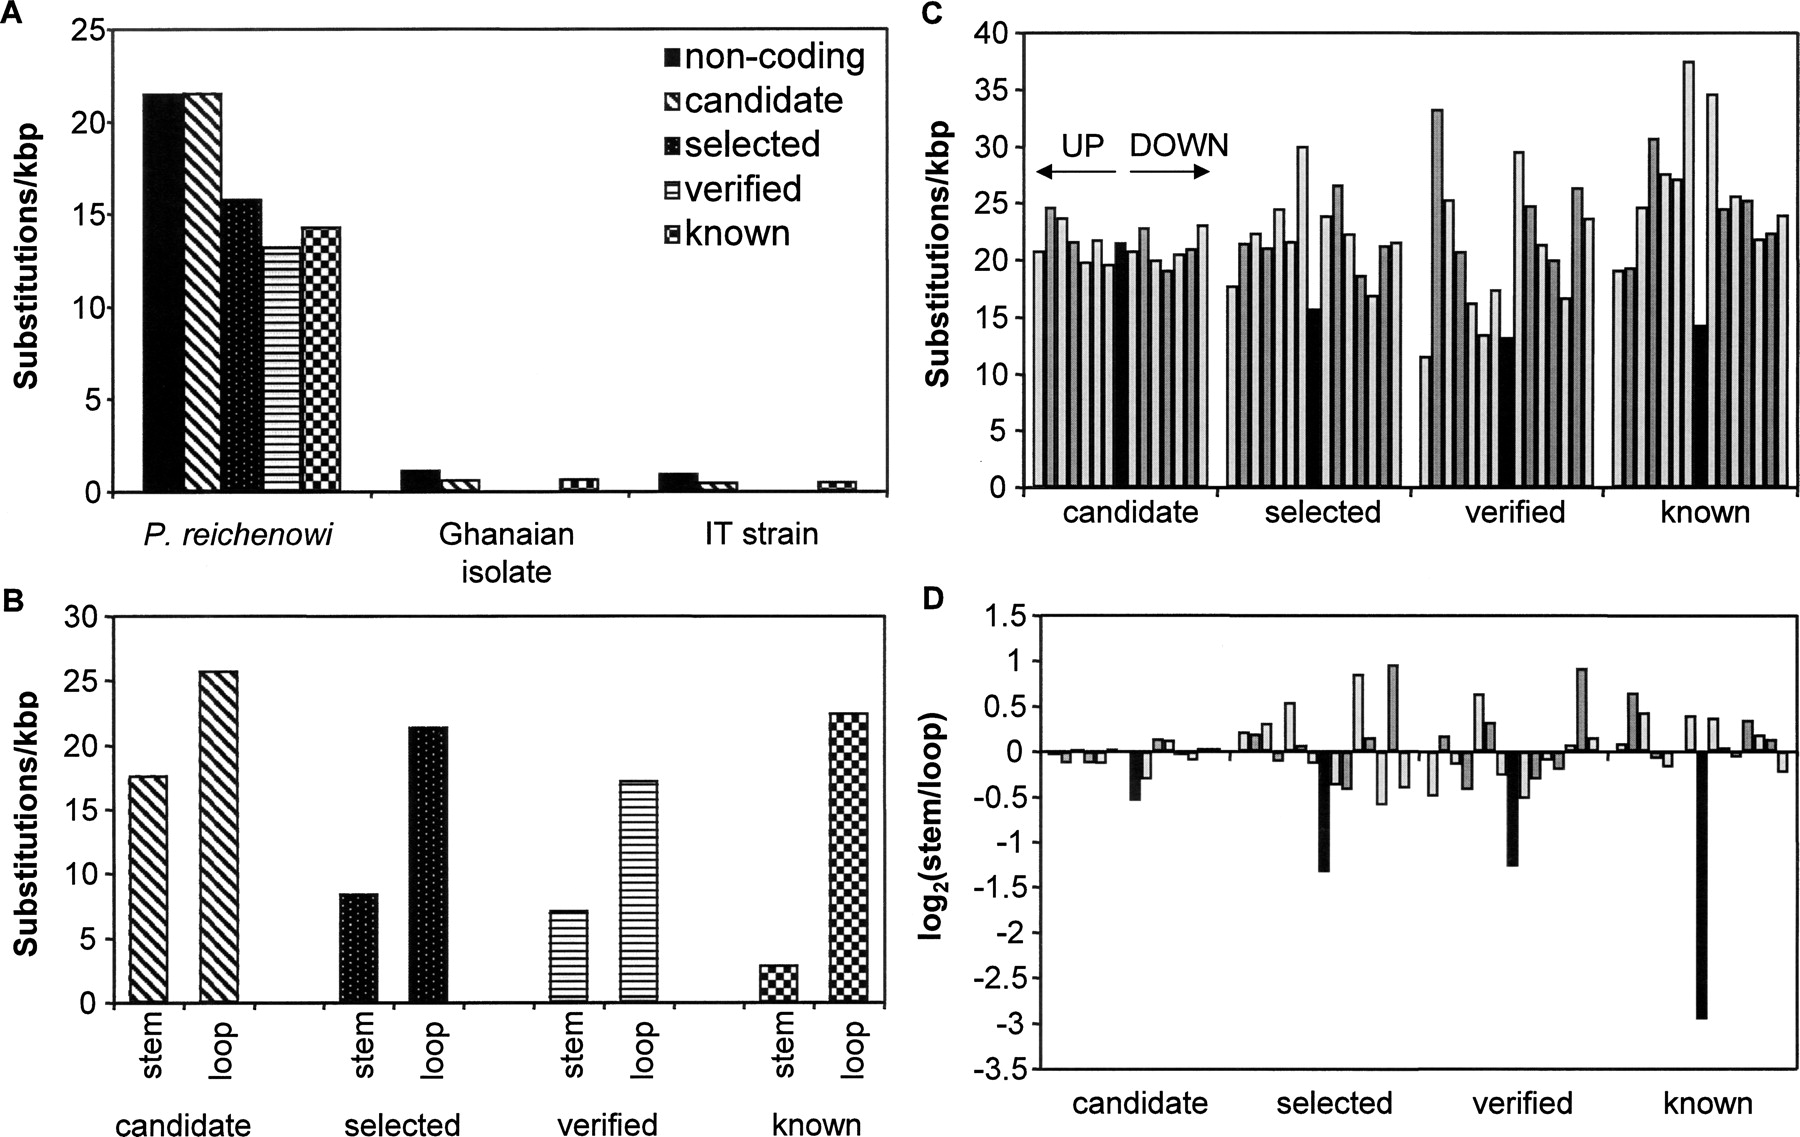
Substitution densities. (A) Density of substitutions and polymorphisms per Kbp for P. falciparum noncoding DNA within the different classes of predictions. Densities are shown for three different alignments; P. falciparum Clone 3D7 against P.f. Ghanaian clinical isolate, P.f. IT strain and P. reichenowi. (B) Each base within each locus was classified as either stem (predicted to form base pairs) or loop (predicted not to form base pairs). Prediction classes as in A. (C) Substitution densities by prediction class (as in A; black bars). Each class of prediction is preceded by virtual predictions translocated to a position of 3000, 2000, 1500, 1000, 750, 500, and 250 bp upstream (based on genomic coordinates, regardless of orientation of prediction), respectively, and succeeded by virtual predictions translocated to similar distances downstream (gray bars). (D) Log(2) ratios of substitution density between STEM and LOOP positions (as defined in B). Black bars denote real candidates, gray bars translocations as described in C.


