
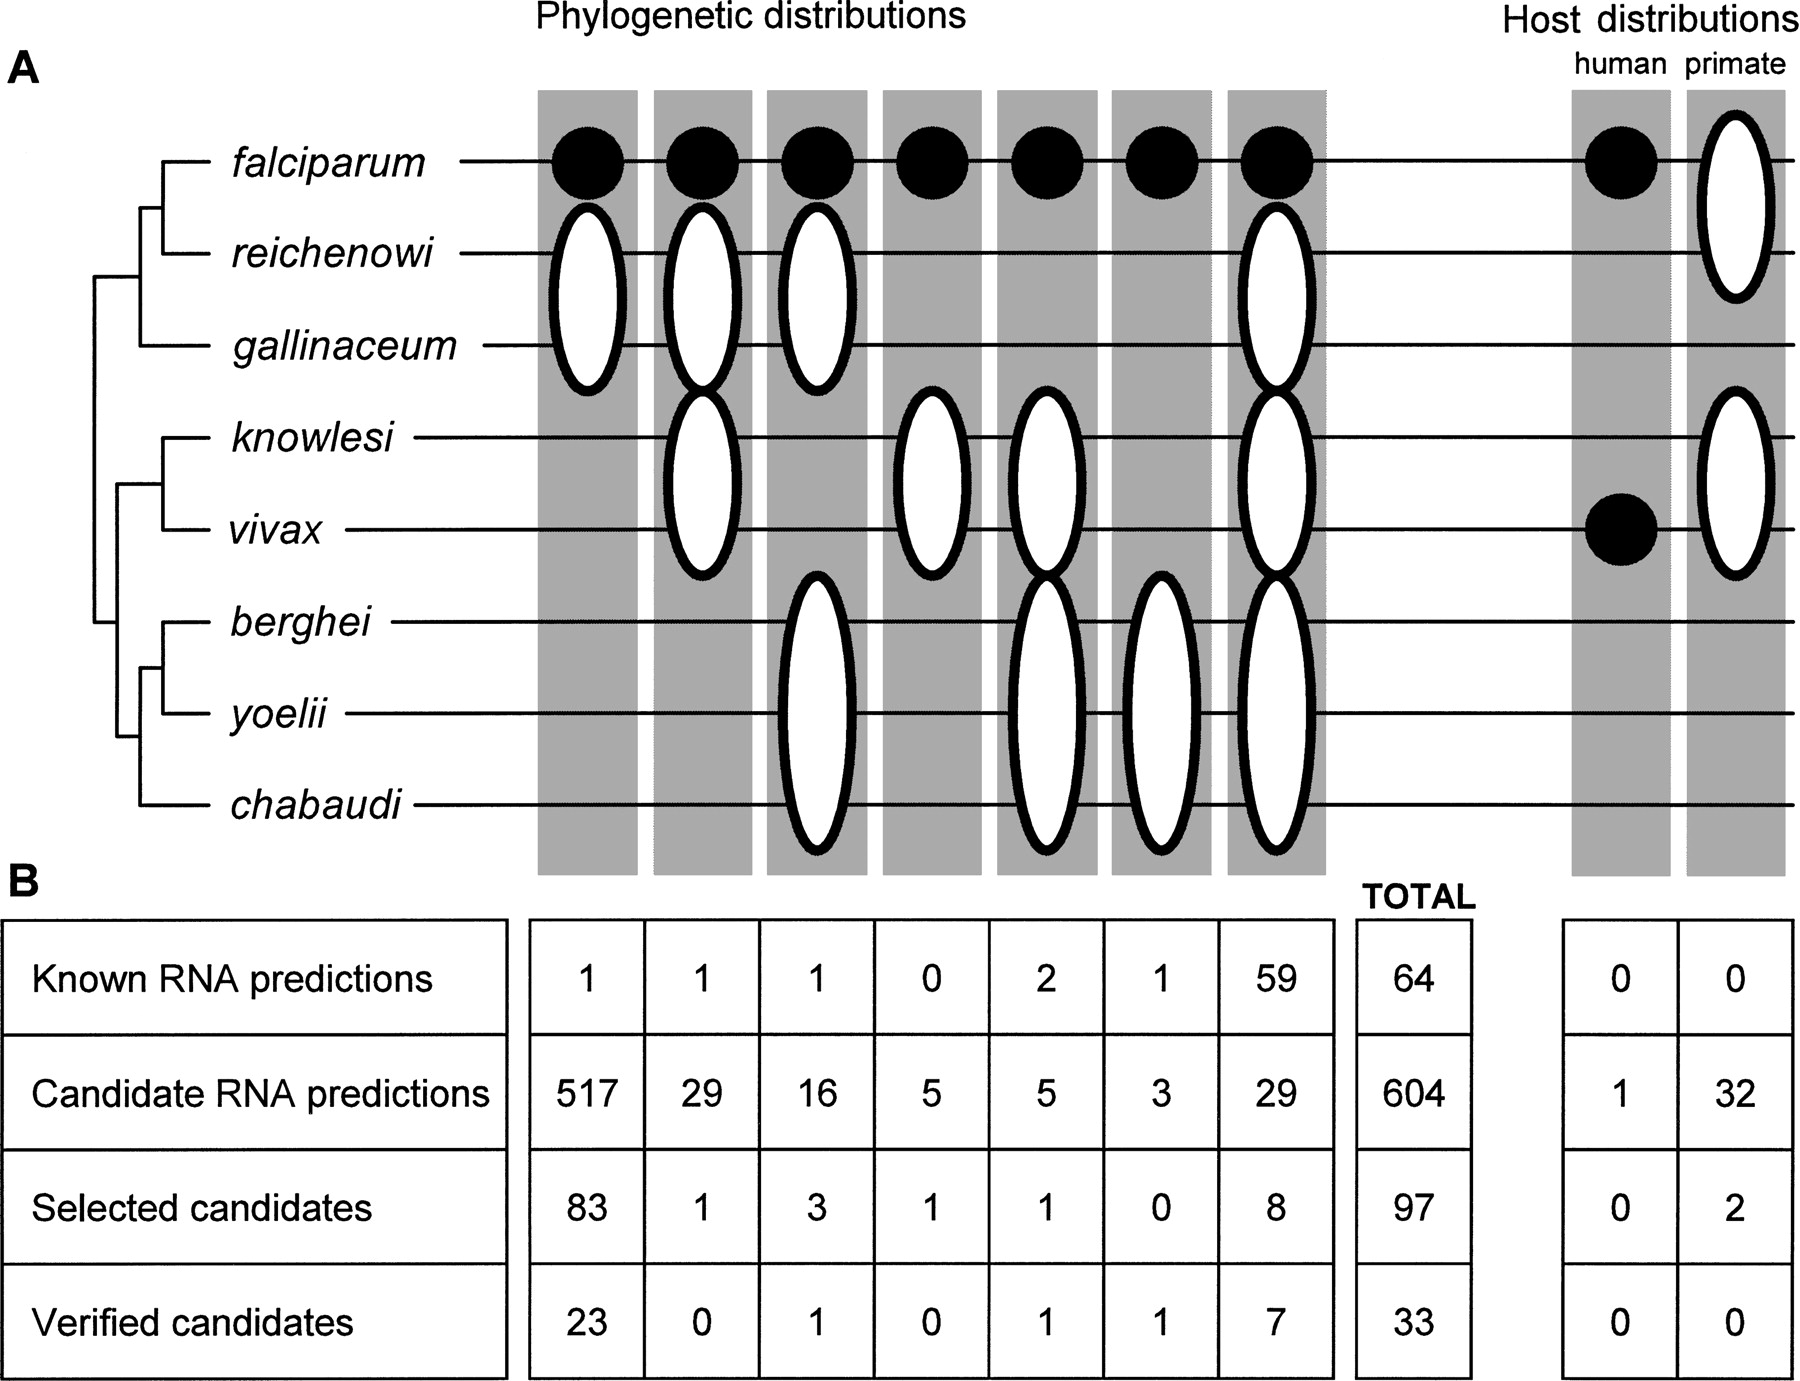
Figure 2.
Phylogenetic distribution of predicted RNA structures. (A) A schematic Plasmodium phylogeny, based on the method of Escalante and Ayala (1994), is shown top left. Phylogenetic distribution combinations are marked in gray boxes. Black circles denote candidates found in the corresponding species. Ellipses indicate that a candidate is found in at least one of the species covered. Two phylogenetic distributions (“human” and “primate”) are functionally denoted by the host of the Plasmodium species. (B) The table indicates the number in each prediction class belonging to a given distribution.


